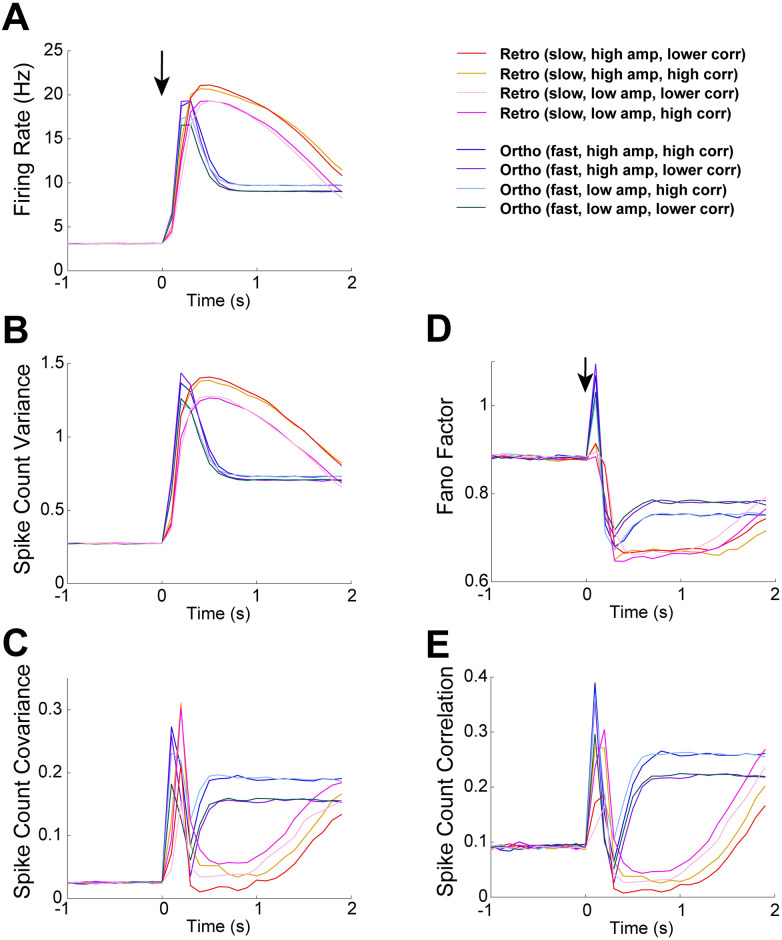
Fig 7. Comparison of all 8 OB model results.
The 8 different OB model results are from varying temporal profile, amplitude height, and input correlation (2 ways each, see Fig 6A). Different temporal profiles is key for both having different model spike statistics and for best matching qualitative differences in our data (see Fig 3). A) Firing rate in Hz (left) is slightly lower with low input rate amplitude, but no significant difference with different input correlations. B) Spike count variance, similar to firing rate, has only slightly lower values with low input rate amplitude. C) Spike count covariance is lower with lower input correlation for all of ortho evoked state (not surprisingly). However, retro (fast) with lower amplitude steadily increases above higher amplitude after about 1 s in the evoked state. D) Fano Factor model results only change modestly. E) Pearson’s spike count correlation, similar to spike count covariance, is lower with lower input correlation and similarly for retro (fast), there is an increase with higher input correlation.

