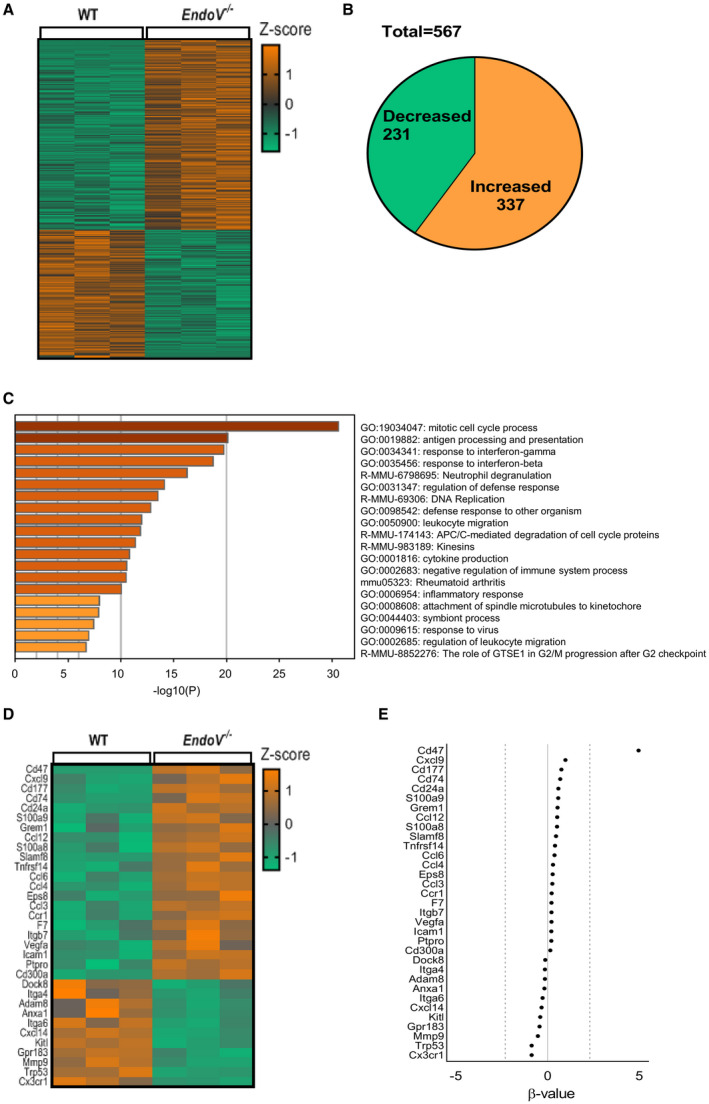
Figure 4. Altered CCL2 gene regulation in macrophages from EndoV−/− mice as compared with WT mice.

RNA sequencing analysis of BMDMs from EndoV −/− mice compared with BMDMs from WT mice stimulated with CCL2: (A) Heat map of differentially expressed transcripts with a q<0.05, (B) pie chart visualizing the alteration of gene expression in EndoV−/− macrophages compared with WT macrophages, and (C) pathway analysis. D, Heat map presentation of the genes annotated to migration in the pathway analysis. E, Natural‐log transformed b value as an estimator of the fold change of genes in D. BMDMs indicates bone marrow derived macrophages; WT, wild type; and EndoV, EndonucleaseV.
