
Figure 1. Derivation of the clusters: consensus k‐means clustering.
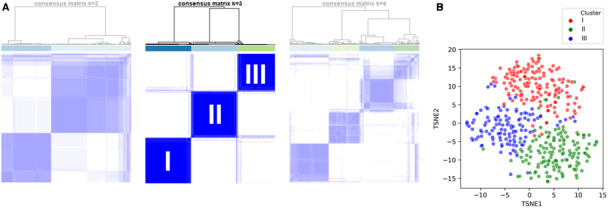
A, Representative plots illustrating the method of consensus k‐means clustering in the CSWG (Cargiogenic Shock Working Group Registry) myocardial infarction derivation cohort. Each column represents one patient, whereas each row displays the assigned clusters. Well‐defined (ie, segregated) squares indicate stable clusters. Compared with k (number of clusters)=2 and k=4, k=3 shows highest cluster stability, suggesting that 3 may be a good choice for the number of clusters. B, A t‐distributed stochastic neighbor embedding (TSNE) plot for visual representation of the clusters in a 2‐dimensional space. The algorithm uses probability estimates to calculate the similarity of data points in the high‐dimensional space (ie, identifies the “neighbors”) and then calculates the distance of these “neighbors” in a lower‐dimensional space (in this case, 2 dimensions).23 The wider the different clusters separate in the plot, the larger is the difference between them.