
Figure 2. Metabolic and hemodynamic profiles of the different phenotypes.
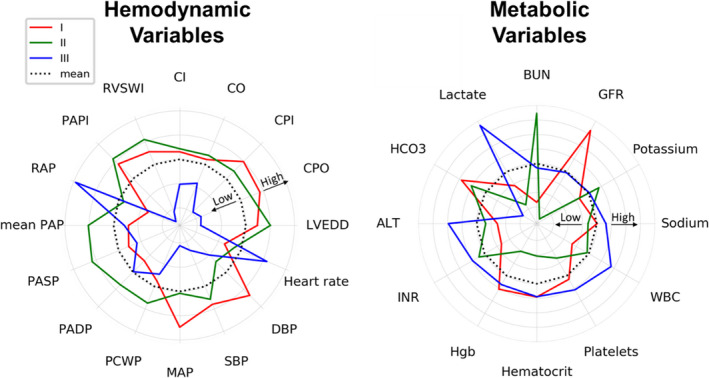
Radar plots illustrate the association of each phenotype with hemodynamic and metabolic variables in CSWG( Cargiogenic Shock Working Group Registry) myocardial infarction cohort. Data were normalized across all phenotypes to a mean of 0 and an SD of 1. The dashed black line marks the mean (0), whereas every concentric gray line signifies a 0.1‐SD difference from the overall mean. Values that were higher than the mean are drawn outside, whereas values that were lower than the mean are drawn inside the dashed line for each variable. ALT indicates alanine aminotransferase; BUN, blood urea nitrogen; CI, cardiac index; CO, cardiac output; CPI, cardiac power index; CPO, cardiac power output; DBP, diastolic blood pressure; GFR, glomerular filtration rate; HCO3, sodium bicarbonate; Hgb, hemoglobin; INR, International Normalized Ratio; LVEDD, left ventricular end‐diastolic dimension; MAP, mean arterial pressure; PADP, pulmonary artery diastolic pressure; PAP, pulmonary artery pressure; PAPI, pulmonary artery pulsatility index; PASP, pulmonary artery systolic pressure; PCWP, pulmonary capillary wedge pressure; RAP, right atrial pressure; RVSWI, right ventricular stroke work index; SBP, systolic blood pressure; and WBC, white blood cell count.