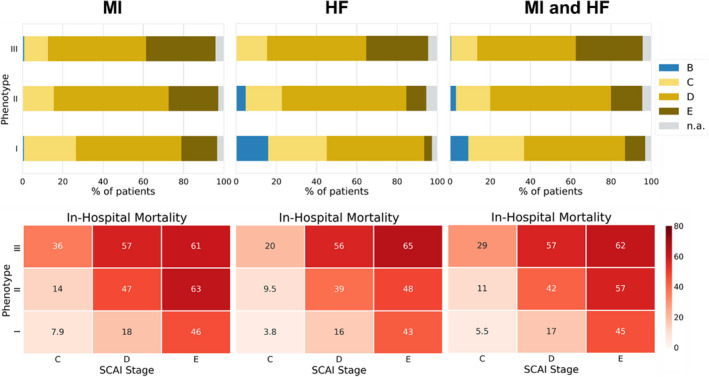
Figure 4. Society for Cardiovascular Angiography and Interventions (SCAI) stages reached during hospital stay by phenotype.

Upper panel: percentage of patients in each phenotype (I: noncongested; II: cardiorenal; III: cardiometabolic) reaching SCAI stage B, C, D, or E during their hospitalization in CSWG (Cardiogenic Shock Working Group Registry) myocardial infarction (MI) cohort, CSWG heart failure (HF) cohort, and both cohorts combined. These graphs can be read as follows: for example, a patient in admission phenotype 3 had a chance of >80% to reach SCAI stage D or E during his/her hospitalization independent of cause of shock (MI or HF). Bottom panel: in‐hospital mortality stratified by phenotype and SCAI stage in percentage for the CSWG‐MI cohort, CSWG‐HF cohort, and both cohorts combined. These graphs can be read as follows: For example, a patient with MI in admission phenotype 2 who only reached SCAI stage C had a probability of 14% for in‐hospital death; however, if the same patient reaches SCAI stage E, his/her probability to die in hospital is 63%. n.a. indicates data insufficient to assign SCAI stage.
