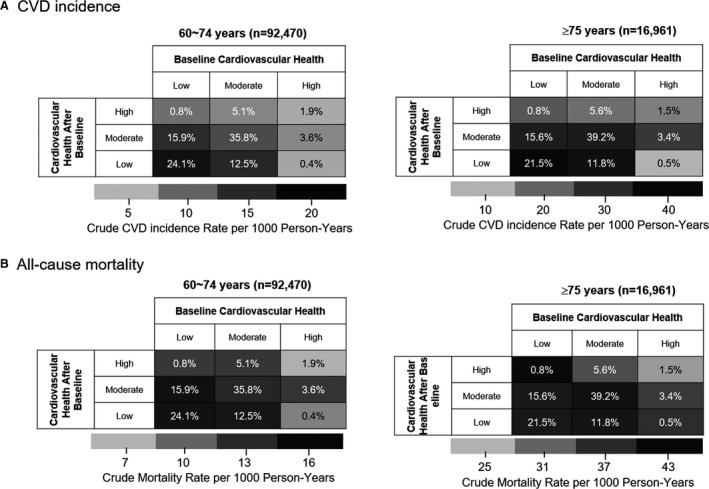
Figure 1. Heatmap of the unadjusted incidence rates of cardiovascular disease (CVD) (A) and all‐cause mortality (B) according to the patterns of change in cardiovascular health between the first and second examinations in the elderly (60–74 years) and very elderly (≥75 years) populations.

Values indicate the percentage of participants in each category, and colors indicate rate per 1000 person‐years.
