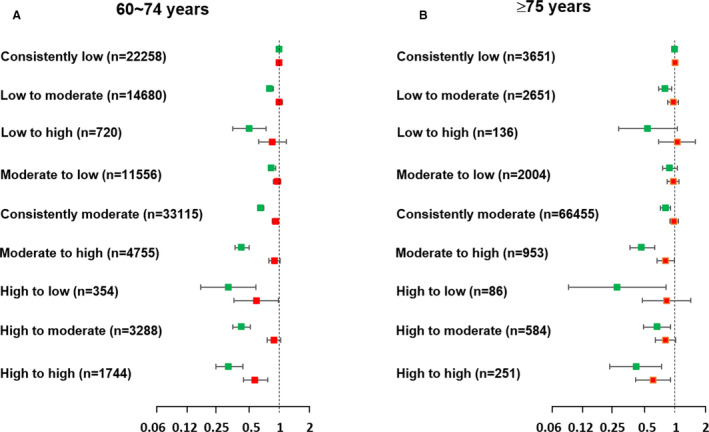
Figure 3. Hazard ratios of cardiovascular disease (green dots) and all‐cause mortality (red dots) according to the pattern of change in the cardiovascular health status between the first and second health examinations in the elderly (60–74 years) (A) and very elderly (≥75 years) (B) populations.

