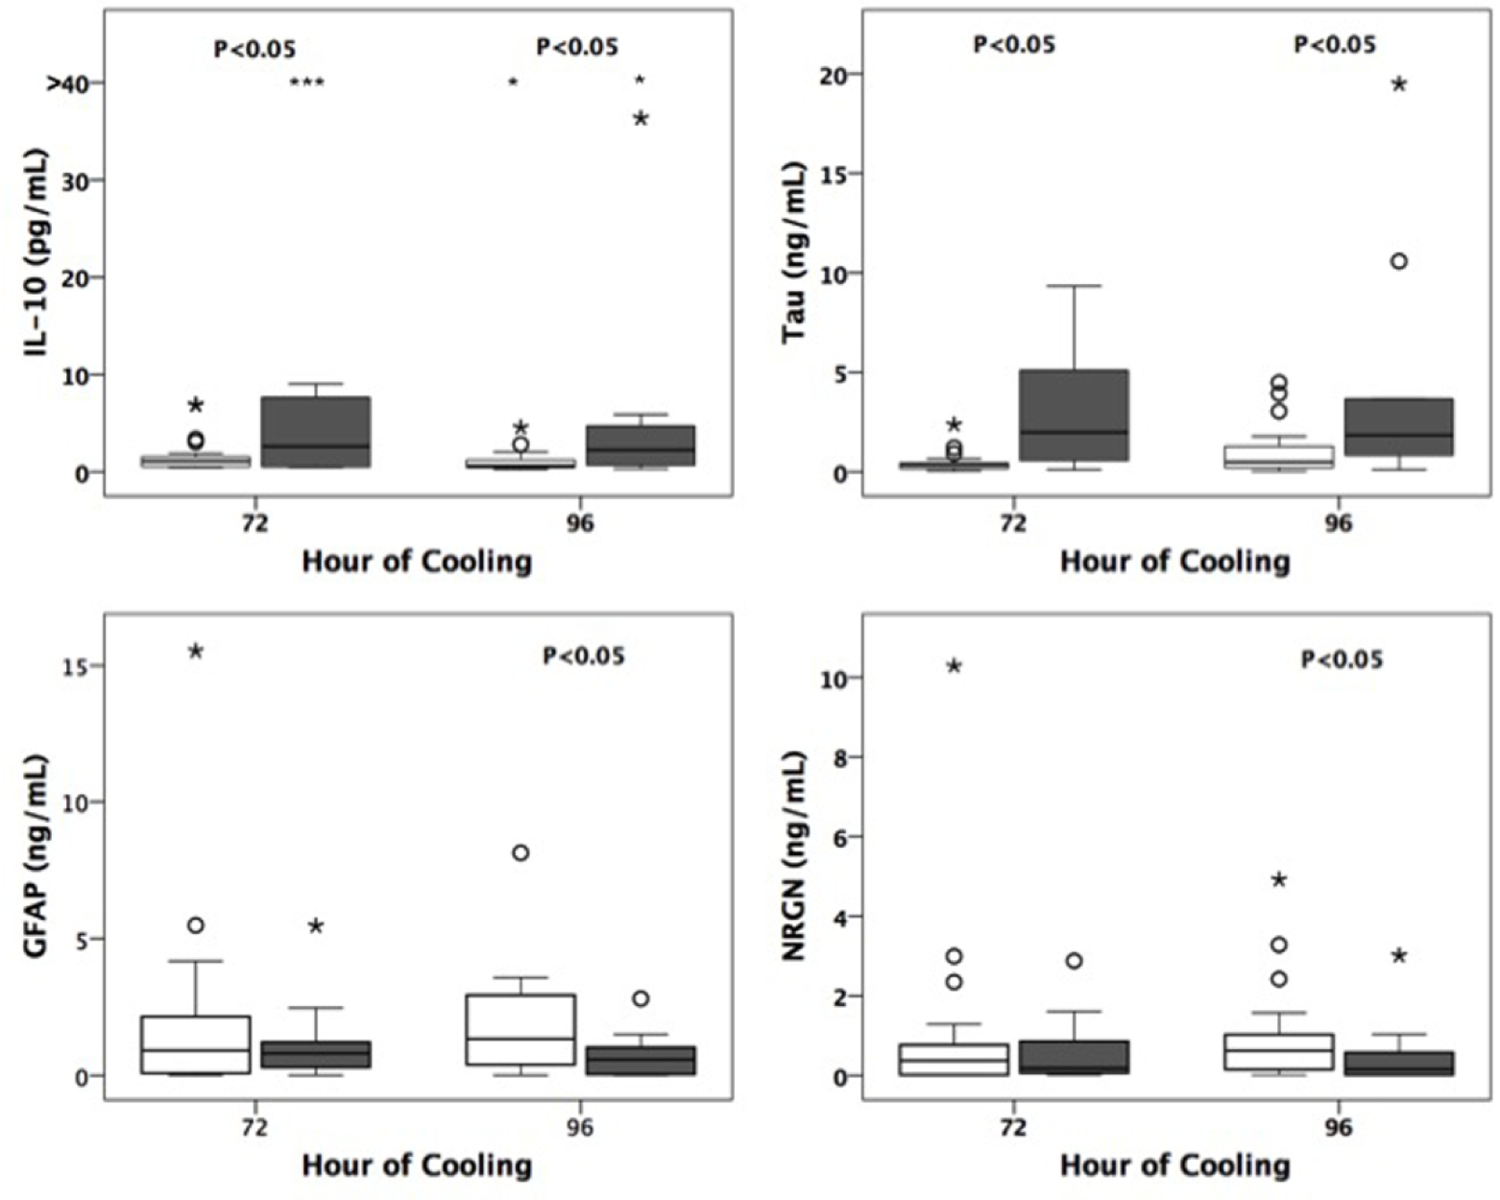
Fig 2.

Box plots depicting medians and interquartile ranges of raw biomarker data over time. Data from infants who died or had significant developmental delay (gray boxes) are compared to those who survived with normal outcomes at 15–30 months. Outliers and extremes represented by open circles and asterisks respectively. § denotes significance (P<0.05) by logistic regression analyses.
