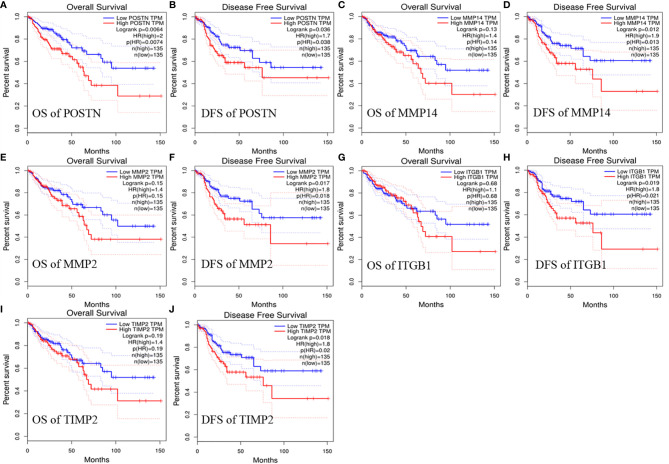
Figure 7.
Relationship between selected target gene expression and prognostic value in patients with COAD. (A) OS and (B) DFS of patients with COAD based on POSTN expression detected using GEPIA. (C) OS and (D) DFS of patients with COAD based on MMP14 expression detected using GEPIA. (E) OS and (F) DFS of patients with COAD based on MMP2 expression detected using GEPIA. (G) OS and (H) DFS of patients with COAD based on ITGB1 expression detected using GEPIA. (I) OS and (J) DFS of patients with COAD based on TIMP2 expression detected using GEPIA.

