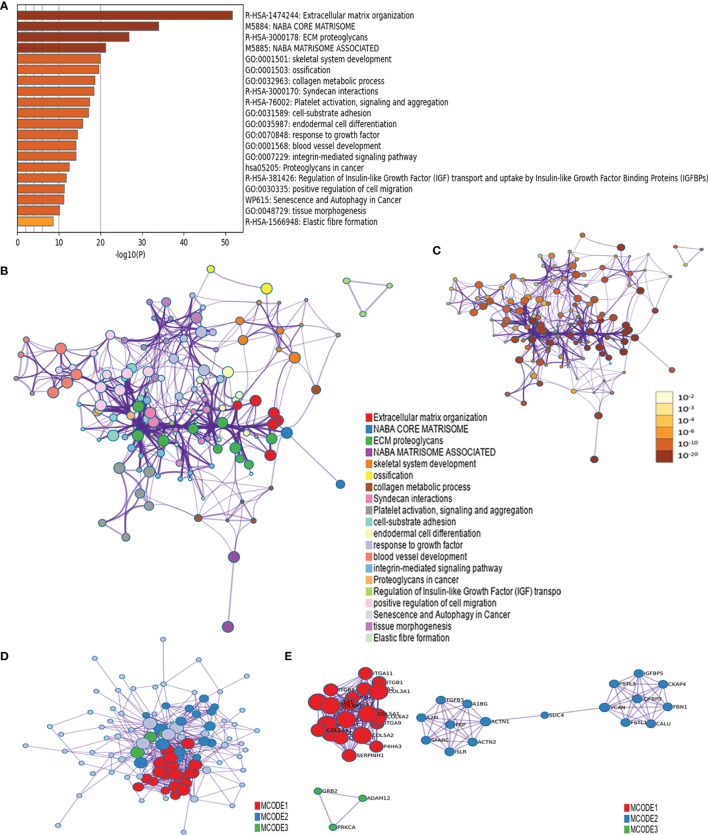
Figure 8.
The functional enrichment analysis of ADAM12 was performed with the Metascape tool. (A) GO enrichment analysis data indicated that these genes were mainly enriched in extracellular matrix (ECM) organization, NABA CORE MATRISOME, ECM proteoglycans, NANA MATRISOME ASSOCIATED, and skeletal system development. (B) The KEGG pathway analysis showed enrichment in extracellular matrix organization, NABA CORE MATRISOME, ECM proteoglycans, NANA MATRISOME ASSOCIATED, and skeletal system development. (C) Nodes in the same enrichment network colored by P value, as shown in the legend. The darker the color, the more significant the node (see legend for P value ranges). (D, E) The protein–protein interaction network showed enrichment in extracellular matrix organization, NABA CORE MATRISOME, ECM proteoglycans, NANA MATRISOME ASSOCIATED, and skeletal system development.

