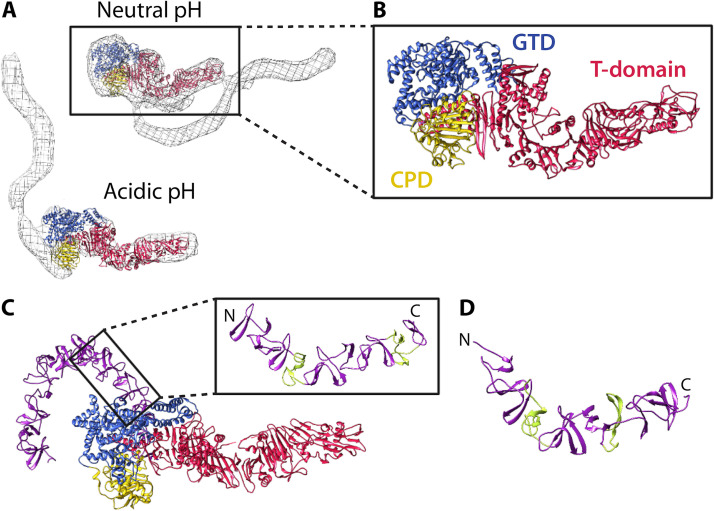
FIG 3.
Structure and organization of the C. difficile holotoxin. (A) TcdA1–1832 (PDB 4R04) fit into the EM map of the TcdA holotoxin at neutral and acidic pH (140) using Chimera (267). The TcdA EM maps were kindly provided by Borden Lacy and are reproduced with permission. (B) Focused view of TcdA1–1832. (C) Structure of TcdB1–2366 at acidic pH (PDB 6OQ5). In the focused image, short repeats (SRs) are colored purple and long repeats (LRs) are colored green. (D) Structure of a fragment of the TcdA CROP (PDB 2G7C), with SRs colored purple and LRs colored green.

