FIG 4.
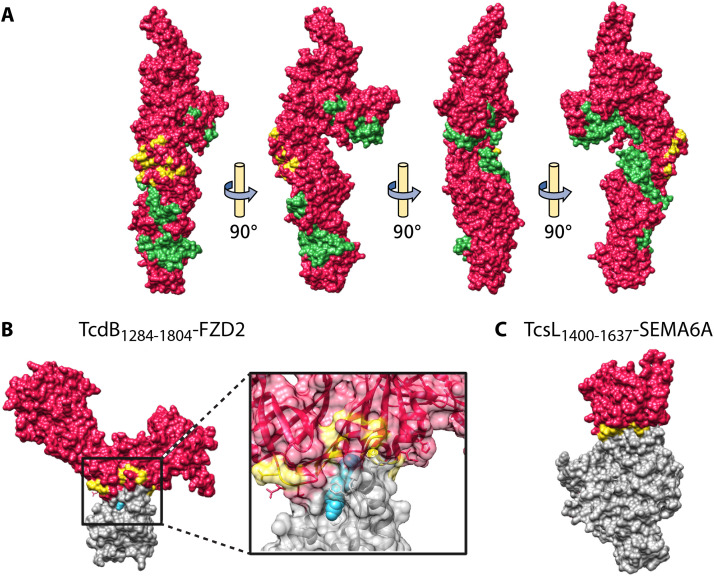
Structure of the LCT T domain and LCT-receptor complexes. (A) T domain of TcdB (PDB 6OQ5), with the hydrophobic helical stretch (residues 956 to 1135) colored green and the interface residues for FZD2 binding colored yellow. (B) TcdB1284–1804-FZD2 (PDB 6C0B), with focus on the receptor-binding interface. TcdB is colored red, FZD2 interface residues on TcdB are colored yellow, FZD2 is colored gray, and palmitoleic acid (PAM) is colored blue. (C) TcsL1400–1637-SEMA6A (PDB 6WTS). TcsL is colored red, SEMA6A interface residues on TcsL are colored yellow, and SEMA6A is colored gray.

