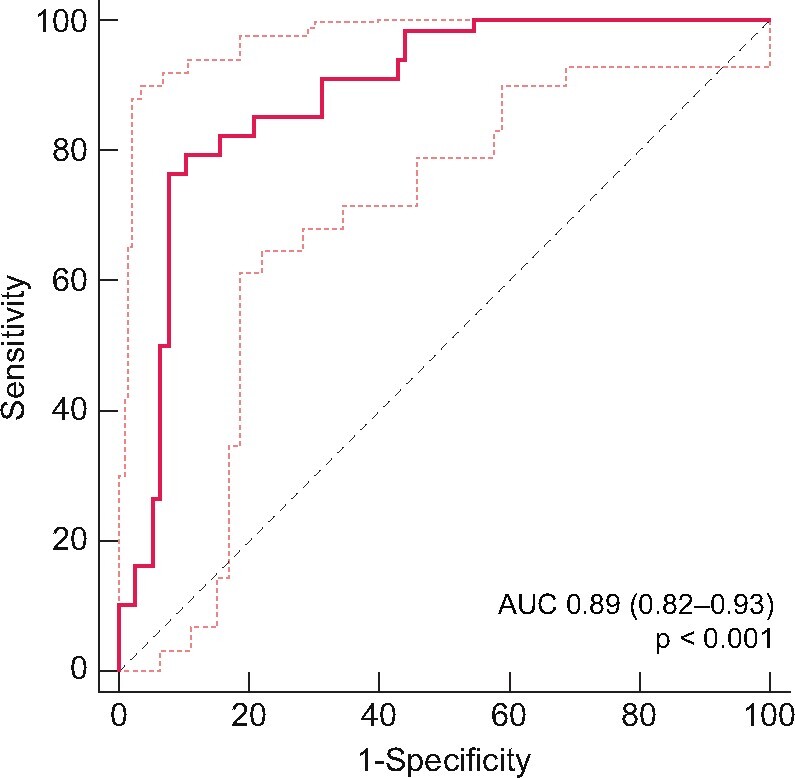
FIGURE 1:

Receiver operating characteristic curve illustrating the ability of a multiple logistic regression model predicting response to COVID-19 vaccine (thresholds 50 UA/mL, 2.5 ± 1.2 months after the second dose). AUC, area under the curve.

Receiver operating characteristic curve illustrating the ability of a multiple logistic regression model predicting response to COVID-19 vaccine (thresholds 50 UA/mL, 2.5 ± 1.2 months after the second dose). AUC, area under the curve.