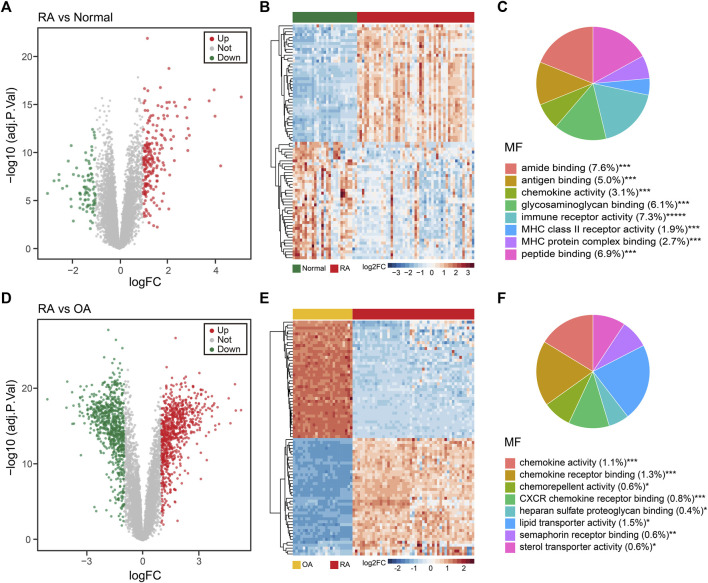
FIGURE 2.
Different expression gene (DEG) analysis of the integrated dataset. (A) Volcano plot of the 287 DEGs between normal and RA patients. Up: upregulated; Down: downregulated; Not: no change. (B) Unsupervised clustering heatmap of the DEGs between normal and RA patients, top 40 were shown. (C) MF enrichment of GO analysis for DEGs between normal and RA patients. MF: molecular function. (D) Volcano plot of the 1,564 DEGs between RA and OA patients. (E) Unsupervised clustering heatmap of the DEGs between RA and OA patients, top 40 were shown. (F) MF enrichment of GO analysis for DEGs between RA and OA patients.

