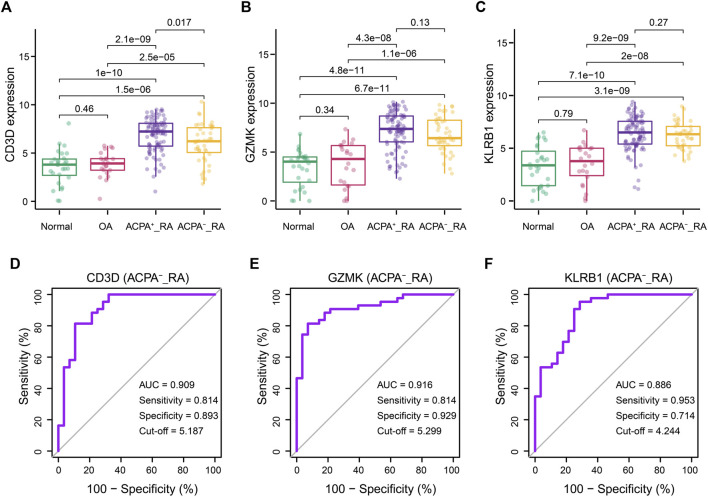
FIGURE 6.
Correlations between CD3D, GZMK, KLRB1, and ACPA-negative RA diagnosis. (A–C) CD3D, GZMK, and KLRB1 distribution for RA patients with ACPA-positive and ACPA-negative. Normal and OA groups served as control. (D–F) Prediction of diagnosis value for ACPA-negative RA patients according to CD3D, GZMK,and KLRB1 expression. ACPA-_RA: ACPA-negative RA.

