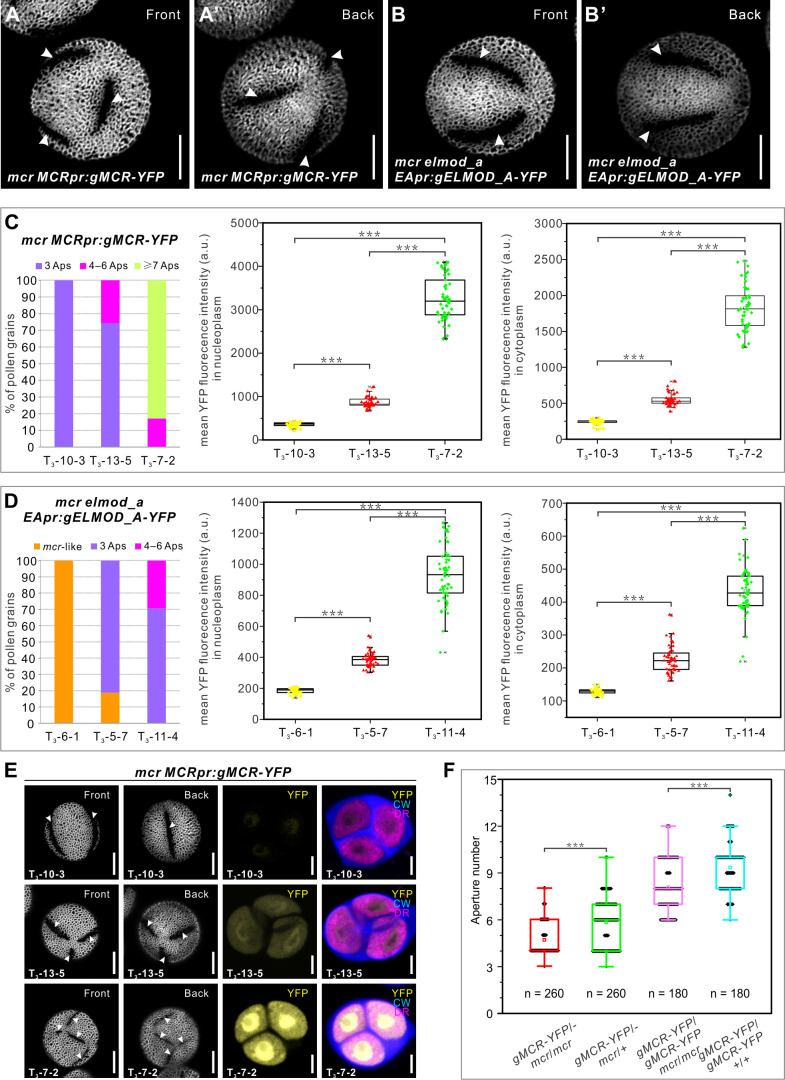
Figure 7. Aperture number is highly sensitive to the levels of MCR and ELMOD_A.
(A–B’) Pollen grains from the mcr MCRpr:gMCR-YFP and mcr elmod_a EApr:gELMOD_A-YFP transgenic lines, respectively, with six and four apertures. (C, D) Quantification of aperture number and mean YFP signal in three homozygous lines of mcr MCRpr:gMCR-YFP (C) and mcr elmod_a EApr:gELMOD_A-YFP (D). Stacked bars show the percentage of pollen grains (from ≥3 individual plants) with indicated number of apertures. Boxplots show mean YFP signal in the microspore nucleoplasm and cytoplasm. a. u.: arbitrary units. (E) Representative images of pollen grains and tetrads corresponding to data in (C). (F) Boxplots showing aperture number depends on the number of functional copies of MCR. Number of analyzed pollen grains (from ≥3 individual plants) is indicated. For all boxplots, boxes represent the first and third quartiles, central lines depict the median, small squares in the boxes indicate the mean values, and small shapes show individual samples. Whiskers extend to minimum and maximum values. ***p<0.001 (two-tailed Student’s t-test). Apertures are indicated with arrowheads. Scale bars, 10 μm for pollen and 5 μm for tetrads.
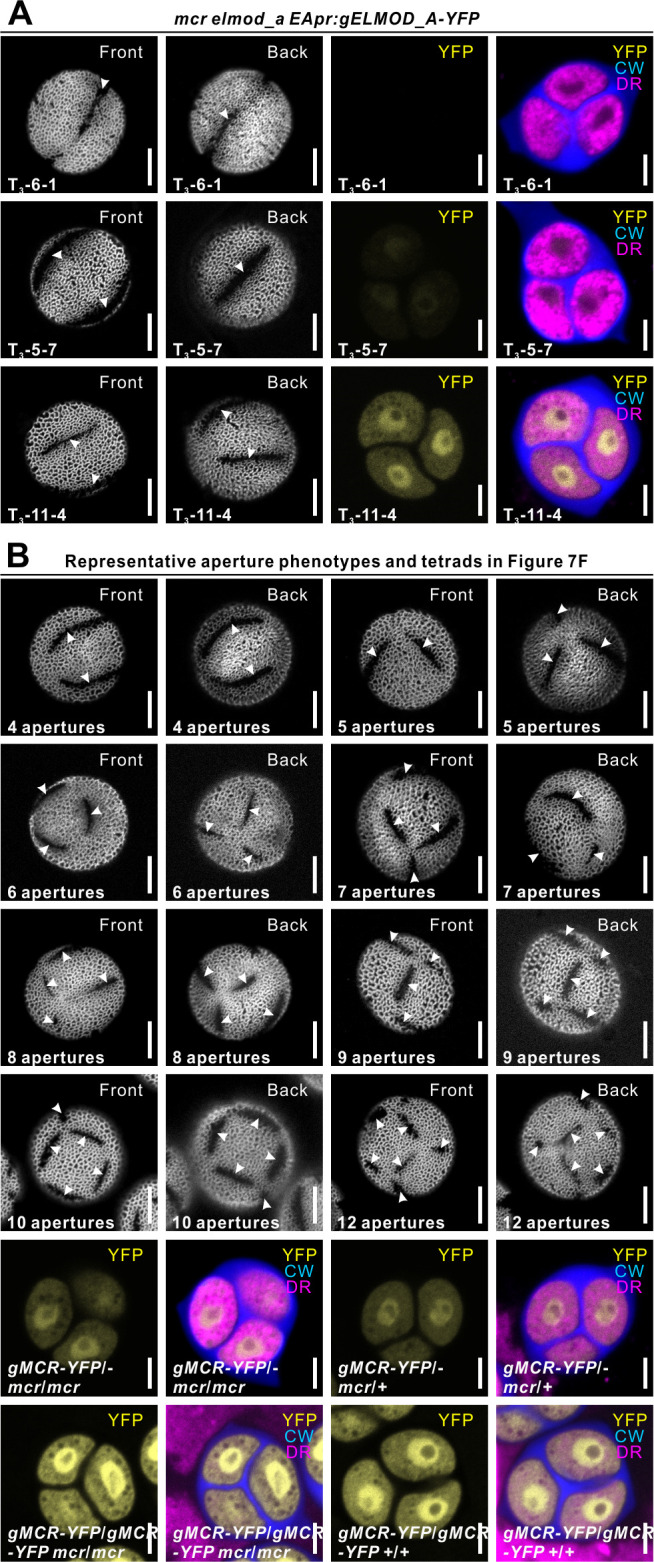
Figure 7—figure supplement 1. Representative aperture phenotypes and tetrads related to Figure 7.


