. 2021 Sep 30;10:e71061. doi: 10.7554/eLife.71061

Figure 9. Arabidopsis ELMOD_E can affect aperture patterns.

(A–D’) Pollen grains from mcr (A, A’) and Col-0 (B–D’) plants expressing MCRpr:gELMOD_E-YFP. (E, E’) Pollen grain from mcr plants expressing ELMOD_Epr:gELMOD_E-YFP. (F–H’) Confocal images of tetrads expressing MCRpr:gELMOD_E-YFP and ELMOD_Epr:gELMOD_E-YFP. Adjacent panels show YFP signal (α) and merged signal (α’) from YFP, Calcofluor White (CW), and CellMask Deep Red (DR). (I–K’) Pollen grains from the F1 plants produced by crossing mcr MCRpr:gELMOD_E-YFP with three T3 lines of mcr MCRpr:gMCR-YFP (with single homozygous insertions of the MCR-YFP transgene, expressed, respectively, at low, medium, and high levels). (L) Percentage of pollen grains with indicated number of apertures in the pollen populations from F1 progeny of the mcr MCRpr:gMCR-YFP T3-7-2 line crossed with mcr or with mcr MCRpr:gELMOD_E-YFP. Number of analyzed pollen grains (from at least two individual plants) is indicated. Apertures are indicated with arrowheads. Scale bars, 10 μm for pollen and 5 μm for tetrads.

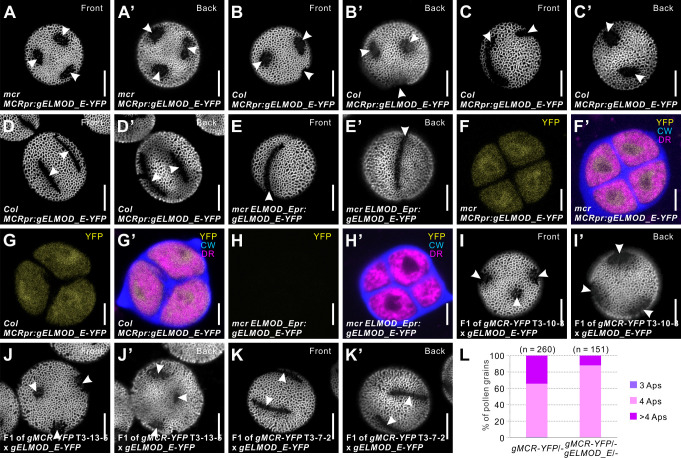
Figure 9.

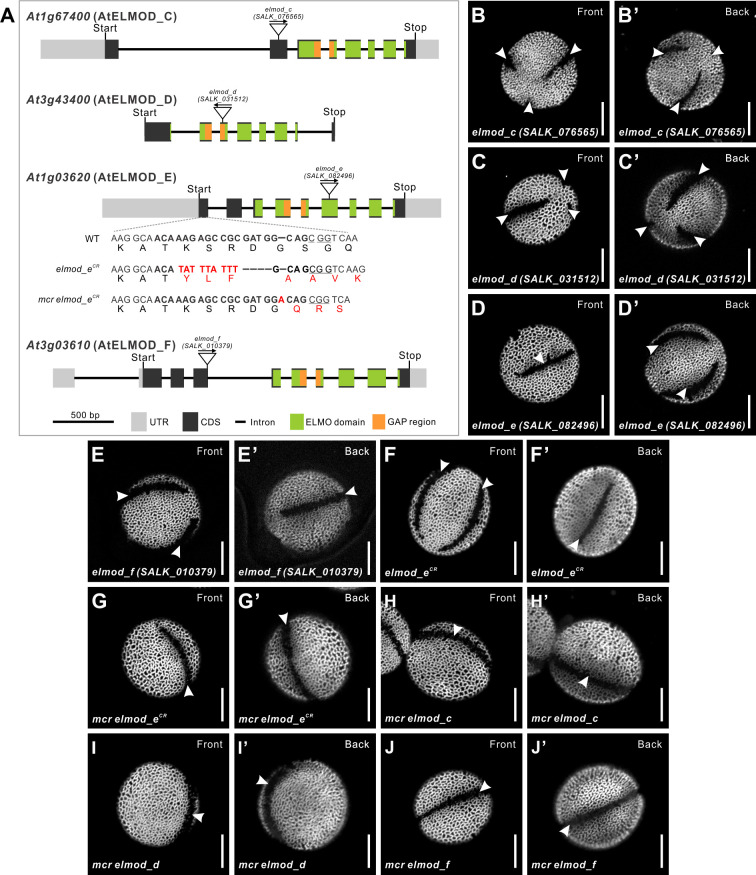
Figure 9—figure supplement 1. Disruptions of Arabidopsis ELMOD_C, ELMOD_D, ELMOD_E, and ELMOD_F do not affect aperture patterns.

Figure 9—figure supplement 1.

(A) Diagram of the ELMOD_C (At1g67400), ELMOD_D (At3g43400), ELMOD_E (At1g03620), and ELMOD_F (At3g03610) genes. T-DNA insertion sites are indicated for each gene. For ELMOD_E, CRISPR alleles (elmod-eCR) were also generated in the wild-type and mcr backgrounds. Both alleles had frame shift mutations. The 20 bp target sequence next to the underlined protospacer adjacent motif is indicated in bold. Nucleotide and amino acid changes are indicated with red capital letters. (B–F’) Pollen grains of single T-DNA insertion mutants of ELMOD_C, ELMOD_D, ELMOD_E, ELMOD_F, and the CRISPR/Cas9 mutant of ELMOD_E (elmod_eCR). (G–J’) Pollen grains of the double mutants mcr elmod_eCR (G, G’), mcr elmod_c (H, H’), mcr elmod_d (I, I’), and mcr elmod_f (J, J’). Apertures are indicated with arrowheads. Scale bars, 10 μm.
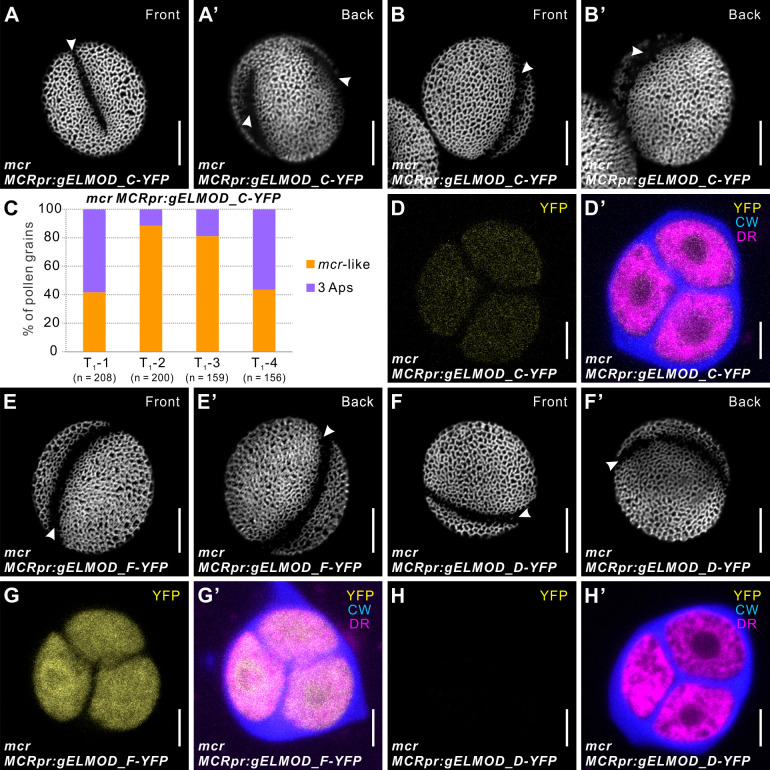
Figure 9—figure supplement 2. ELMOD_C, but not ELMOD_D and ELMOD_F, can partially substitute for MCR in aperture formation.

Figure 9—figure supplement 2.

(A–B’, E–F’) Pollen grains from mcr MCRpr:gELMOD_C-YFP (A–B’), mcr MCRpr:gELMOD_F-YFP (E, E’), and mcr MCRpr:gELMOD_D-YFP (F, F’). Apertures are indicated with arrowheads. (D, D’ and G–H’) Confocal images of mcr tetrads expressing YFP fusions of ELMOD_C, ELMOD_F, and ELMOD_D. (D, D’) mcr tetrads expressing MCRpr:gELMOD_C-YFP have detectable YFP fluorescence. (G, G’) mcr tetrads expressing MCRpr:gELMOD_F-YFP show strong YFP fluorescence. (H, H’) There is no observable YFP fluorescence in the mcr tetrads expressing MCRpr:gELMOD_D-YFP. Adjacent panels show YFP fluorescence (α) and merged fluorescent signal (α’) from YFP, Calcofluor White (CW), and CellMask Deep Red (DR). Scale bars, 10 μm for pollen and 5 μm for tetrads. (C, C’) Percentage of pollen grains with indicated number of apertures in pollen populations from the T1 plants of mcr MCRpr:gELMOD_C-YFP. Number of analyzed pollen grains is indicated.