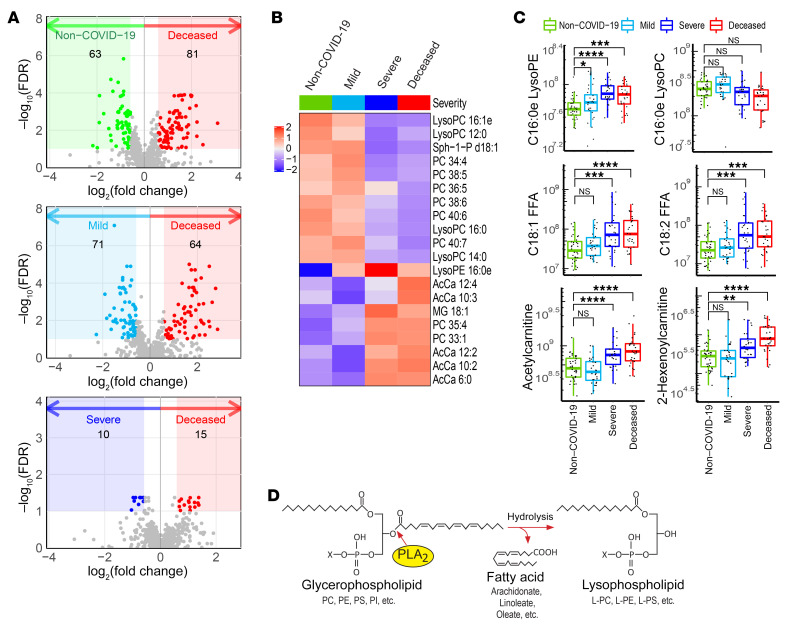
Figure 1. Untargeted lipidomics analysis and COVID-19 status.
Plasma samples from non–COVID-19 patients, those with mild COVID-19, those with severe COVID-19, and deceased COVID-19 patients were subjected to untargeted metabolomics analyses. Lipidome data were extracted from the metabolomics data set and analyzed. (A) Volcano plots show significant alterations in the lipidome of the deceased COVID-19 patients compared with that of the non–COVID-19 patients, patients with mild COVID-19, and patients with severe COVID-19. Colored areas highlight compounds with a FC of greater than 1.5 and a FDR of less than 0.1. (B) Heatmap of the top 20 metabolites whose abundances varied markedly across non–COVID-19 patients (Non–COVID-19), patients with mild COVID-19 (Mild), patients with severe COVID-19 (Severe), and deceased COVID-19 patients (Deceased). (C) Abundances of 2 lyso-PLs, 2 FFAs, and 2 short-chain acyl carnitines extracted from the untargeted lipid data. C16:0e lyso-PC in the upper right panel is an example of a PC-containing lysolipid that did not meet the FC and FDR criteria in A and is not a primary substrate of sPLA2-IIA. The other 5 compounds were selected from the colored regions in A (FDR <0.1) and may have resulted from the action of sPLA2-IIA. The levels in each panel were further compared using a 1-sided Wilcoxon test with Holm’s correction for multiple testing. For the box plots, the upper and lower bounds indicate the 75th (Q3) and 25th (Q1) percentiles, respectively; the line within the box indicates the median value; whiskers extend to values within 1.5 IQR (IQR, Q3–Q1) of the upper or lower bound; outlying values are shown between 1.5 and 3 IQR beyond the upper or lower bound. *P < 0.05, **P < 0.01, ***P < 0.001, and ****P < 0.0001. (D) Model of PLA2 reaction showing how PLA2 hydrolyzes the sn-2 position of the glycerol backbone of phospholipids to form lyso-PL and FFA products.

