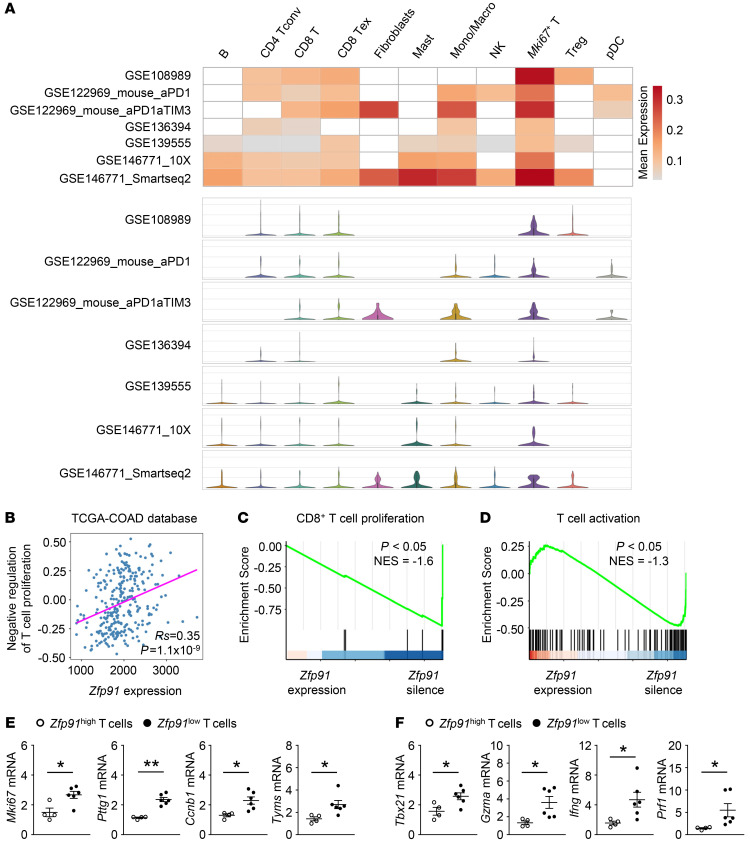
Figure 1. Impairments in T cell proliferation and activation are correlated with ZFP91 in CRC.
(A) The heatmap shows the average mRNA expression of ZFP91, and the violin plot shows the distribution of ZFP91 mRNA expression in different cell types from 7 scRNA-Seq data sets for COAD. B, B cells; CD4 Tconv, CD4+ conventional T cells; CD8 T, CD8+ T cells; CD8 Tex, exhausted CD8+ T cells; Mast, mast cells; Mono/Macro, monocytes and macrophages; NK, natural killer cells; Mki67+ T, proliferating Mki67+ T cells; pDC, plasmacytoid DCs. (B) Spearman’s correlation of mRNA expression of Zfp91 and the GSVA score for negative regulation of T cell proliferation in TCGA COAD database. (C and D) GSEA of the signature genes for the regulation of CD8+ αβ T cell proliferation (C) and αβ T cell activation (D) in ZFP91-expressing and ZFP91-silenced T cells. NES, normalization enrichment score. (E and F) qRT-PCR analysis of genes associated with T cell proliferation (E) and activation (F) in tumor-infiltrating T cells from CRC. The normalized Zfp91 expression value of tumor-infiltrating T cells with the lowest expression of Zfp91 was set at 1. The normalized Zfp91 expression values of Zfp91hi T cells were higher than 2 (n = 4), and those of Zfp91lo T cells were less than 2 (n = 6). Data in E and F are representative of 3 independent experiments. Data are represented as the mean ± SEM. *P < 0.05 and **P < 0.01 by calculated by permutation test (C and D) and 2-tailed Student’s t test (E and F).

