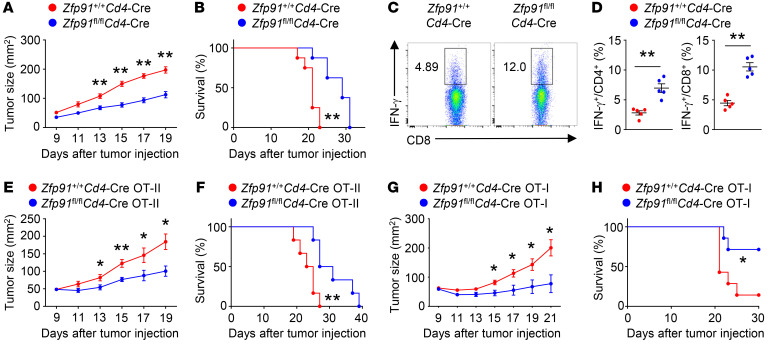
Figure 2. ZFP91 dampens T cell antitumor functions.
(A and B) Tumor progression (A) and survival curves (B) for Zfp91+/+ Cd4-Cre and Zfp91fl/fl Cd4-Cre mice that received a s.c. injection of 5 × 10⁵ MC38 murine colon cancer cells (n = 8). (C and D) Flow cytometric analysis of T cells in tumors of Zfp91+/+ Cd4-Cre and Zfp91fl/fl Cd4-Cre mice injected s.c. with MC38 murine colon cancer cells (day 14). The data are presented as representative plots (C) and as summary graphs (D) (n = 5). (E and F) Tumor progression (E) and survival curves (F) for B6.SJL mice that received an i.v. injection of 2 × 10⁶ Zfp91+/+ Cd4-Cre OT-II or Zfp91fl/fl Cd4-Cre OT-II CD4+ T cells 7 days after s.c. injection of 5 × 10⁵ MC38-OVA colon cancer cells (n = 6). (G and H) Tumor progression (G) and survival curves (H) for B6.SJL mice given an i.v. injection of 2 × 10⁶ Zfp91+/+ Cd4-Cre OT-I and Zfp91fl/fl Cd4-Cre OT-I CD8+ T cells 7 days after s.c. injection of 5 × 10⁵ MC38-OVA colon cancer cells (n = 7). Experiments were independently repeated 3 times. Data are presented as the mean ± SEM. *P < 0.05 and **P < 0.01, by 2-tailed Student’s t test (A, D, E, and G) and log-rank (Mantel-Cox) test (B, F, and H).

