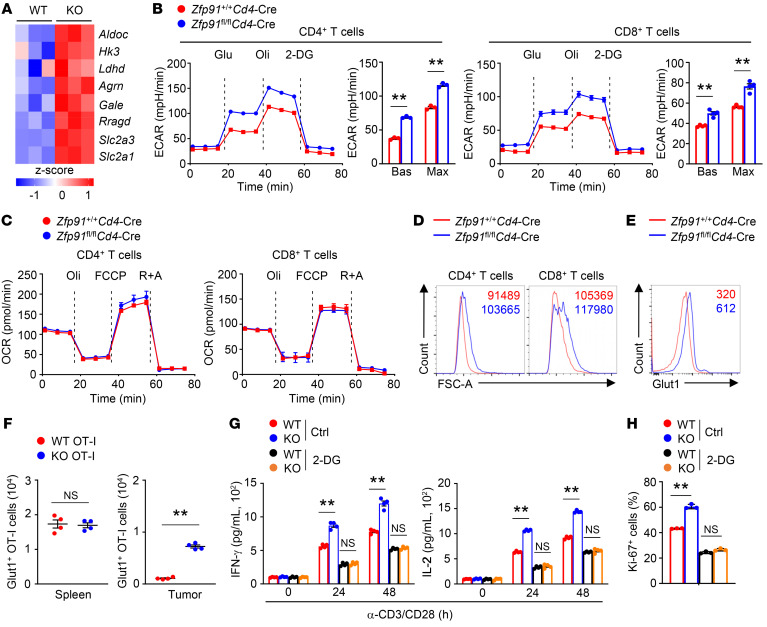
Figure 5. ZFP91 suppresses T cell glycolytic metabolism.
(A) Heatmap of upregulated genes associated with T cell glycolysis in ZFP91-deficient T cells relative to gene expression in WT T cells stimulated with anti-CD3 and anti-CD28 antibodies for 24 hours. (B) ECAR of Zfp91+/+ Cd4-Cre and Zfp91fl/fl Cd4-Cre CD4+ or CD8+ T cells stimulated with anti-CD3 and anti-CD28 antibodies for 24 hours, at baseline (Bas) and in response to glucose (Glu), oligomycin (Oli), and 2-DG (n = 3 or 4). Max, maximum. (C) OCRs of Zfp91+/+ Cd4-Cre and Zfp91fl/fl Cd4-Cre CD4+ or CD8+ T cells stimulated with anti-CD3 and anti-CD28 antibodies for 24 hours, at baseline and in response to oligomycin, FCCP, and rotenone plus antimycin (R+A) (n = 3–4). (D) Flow cytometric analysis of cell size (forward scatter area [FSC-A]) for Zfp91+/+ Cd4-Cre and Zfp91fl/fl Cd4-Cre CD4+ or CD8+ T cells stimulated with anti-CD3 and anti-CD28 antibodies for 24 hours. (E) Flow cytometric analysis of Glut1 expression in T cells in tumors from Zfp91+/+ Cd4-Cre and Zfp91fl/fl Cd4-Cre mice injected s.c. with MC38 murine colon cancer cells (day 14). (F) Number of Glut1+ OT-I cells in the spleen and tumor from MC38-OVA tumor–bearing mice transferred with OT-I cells (on day 7 after adoptive transfer of OT-I cells) (n = 4). (G and H) ELISA of IFN-γ and IL-2 in supernatants (G, n = 4) and flow cytometric analysis of Ki-67 expression (H, n = 3) in Zfp91+/+ Cd4-Cre (WT) and Zfp91fl/fl Cd4-Cre (KO) T cells stimulated with anti-CD3 and anti-CD28 (α-CD3/CD28) antibodies for 48 hours in the presence of 2-DG (2 mM) or control (Ctrl). Experiments were independently repeated 3 times. Data are presented as the mean ± SEM. **P < 0.01, by 2-tailed Student’s t test.

