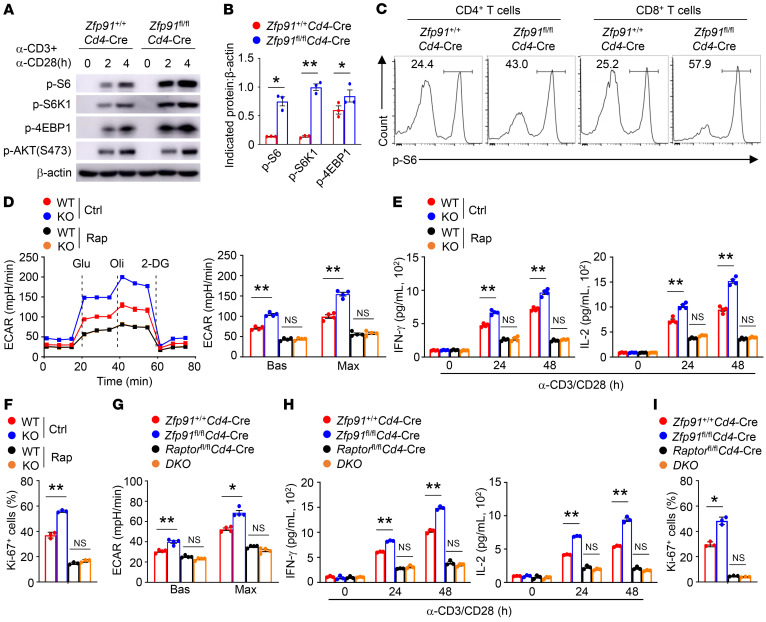
Figure 6. Regulation of T cell glycolysis by ZFP91 is dependent on mTORC1.
(A) IB analysis of the indicated proteins in Zfp91+/+ Cd4-Cre and Zfp91fl/fl Cd4-Cre T cells stimulated with anti-CD3 and anti-CD28 antibodies. (B) Quantification of the indicated proteins; β-actin levels in Zfp91+/+ Cd4-Cre and Zfp91fl/fl Cd4-Cre T cells stimulated with anti-CD3 and anti-CD28 antibodies for 2 hours (n = 3). (C) Flow cytometric analysis of p-S6 levels in Zfp91+/+ Cd4-Cre and Zfp91fl/fl Cd4-Cre CD4+ or CD8+ T cells stimulated with anti-CD3 and anti-CD28 antibodies for 2 hours. (D–F) ECAR (D, n = 4), ELISA of IFN-γ and IL-2 in supernatants (E, n = 4), and flow cytometric analysis of Ki-67 expression (F, n = 3) in Zfp91+/+ Cd4-Cre (WT) and Zfp91fl/fl Cd4-Cre (KO) T cells stimulated with anti-CD3 and anti-CD28 antibodies for 24 hours (D) or 48 hours (E and F) in the presence of rapamycin (Rap, 1 µM). (G–I) ECAR (G, n = 4), ELISA of IFN-γ and IL-2 in supernatants (H, n = 3), and flow cytometric analysis of Ki-67 expression (I, n = 3) in Zfp91+/+ Cd4-Cre, Zfp91fl/fl Cd4-Cre, Raptorfl/fl Cd4-Cre, and Zfp91fl/fl Raptorfl/fl Cd4-Cre (DKO) CD90.2+ T cells stimulated with anti-CD3 and anti-CD28 antibodies for 24 hours (G) or 48 hours (H and I). Experiments were independently repeated 3 times. Data are presented as the mean ± SEM. *P < 0.05 and **P < 0.01, by 2-tailed Student’s t test. Max, maximum.

