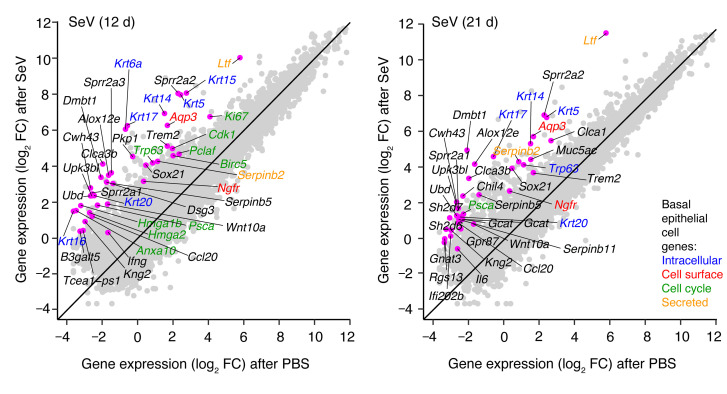
Figure 1. Induction of basal epithelial cell growth and differentiation genes after SeV infection.
Gene-gene expression plots for RNA-Seq analysis of lung tissue from WT mice 12 and 21 days (d) after SeV infection versus control PBS challenge. Annotations indicate 25 genes with the greatest fold change (FC) in expression levels for SeV versus PBS (excluding immunoglobulin genes and adding informative basal epithelial cell genes, which are annotated by colors). Data represent results from a single experiment with 3 mice per condition.

