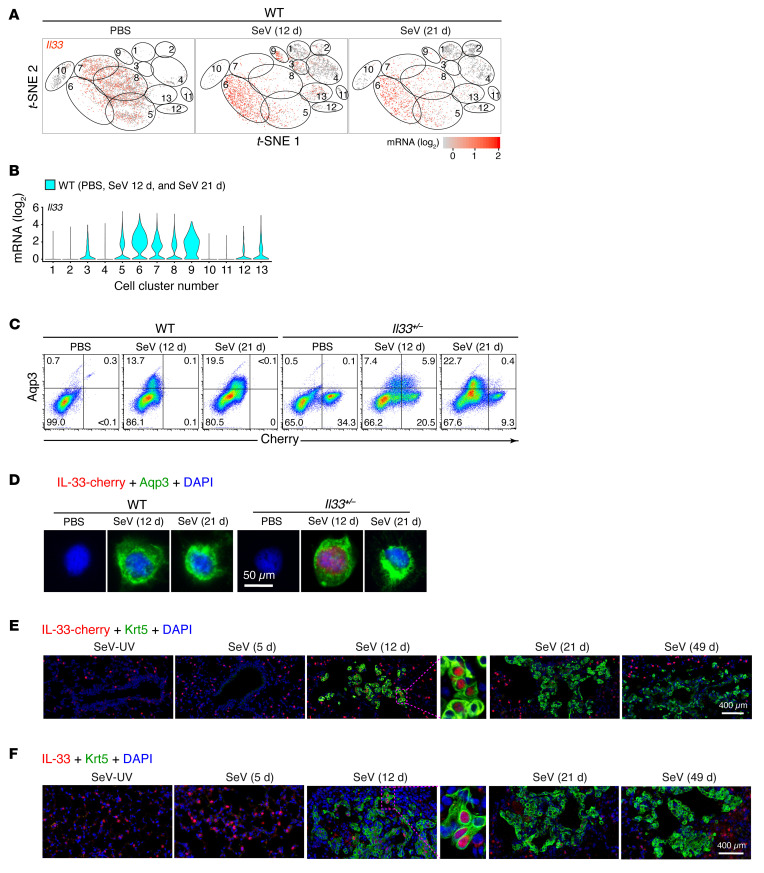
Figure 6. Single-cell analysis reveals IL-33 expression in a basal ESC subset linked to the cell cycle.
(A) t-SNE plots for Il33 gene expression in WT mice for each sample condition (PBS treatment or 12 days and 21 days after SeV infection). (B) Corresponding violin plots for Il33 gene expression for the combined sample conditions in A. (C) Flow cytograms of lung epithelial cells based on Aqp3 and IL-33–cherry reporter expression in WT and heterozygous Il33+/– mice for each sample condition. Values indicate the percentage of cells within each gate. (D) Immunostaining for the IL-33–cherry reporter and Aqp3 for FACS-isolated Aqp3+IL-33–cherry+ cells under the conditions in C. Scale bar: 50 μm. (E) Immunostaining for IL-33–cherry and Krt5 in lung sections from Il33+/– mice 5–49 days after SeV or SeV-UV infection. Scale bar: 400 μm. Original magnification, ×4.4 (inset). (F) Immunostaining for IL-33 and Krt5 in lung sections from WT mice 5–49 days after SeV or SeV-UV infection. Scale bar: 400 μm. Original magnification, ×3.6 (inset). For A and B, data represent results from a single experiment with 3 mice per condition; for C–F, data represent results from a single experiment with 5 mice per condition, and experiments were replicated twice.

