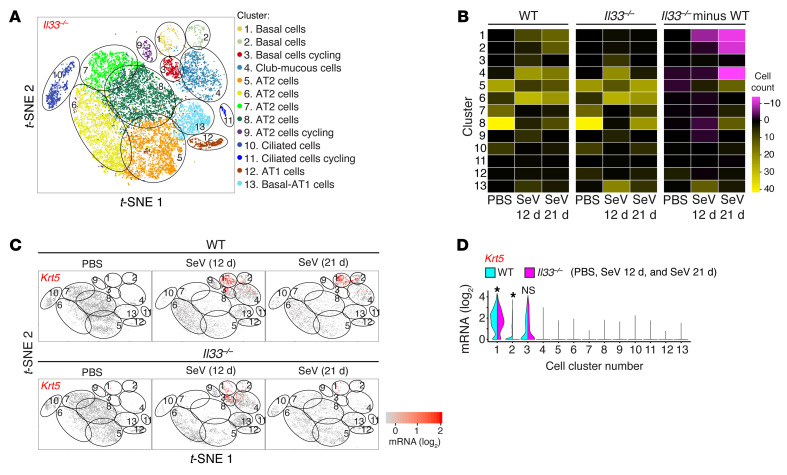
Figure 7. Comparative scRNA-Seq analysis of lung epithelial cells to link IL-33 expression to the cell cycle.
(A) t-SNE plot for lung epithelial cell clusters in Il33–/– mice for combined sample conditions (12 and 21 days after SeV infection or PBS treatment). (B) Heatmap of the number of cells in each cluster for each sample condition for WT and Il33–/– mice and the differences between these mouse strains. (C) t-SNE plots for Krt5 gene expression for each sample condition in WT and Il33–/– mice. (D) Violin plot for Krt5 expression for the combined sample conditions in C. Data represent results from a single experiment with 3 mice per condition. *P < 0.05, by Mann-Whitney U test with Bonferroni correction.

