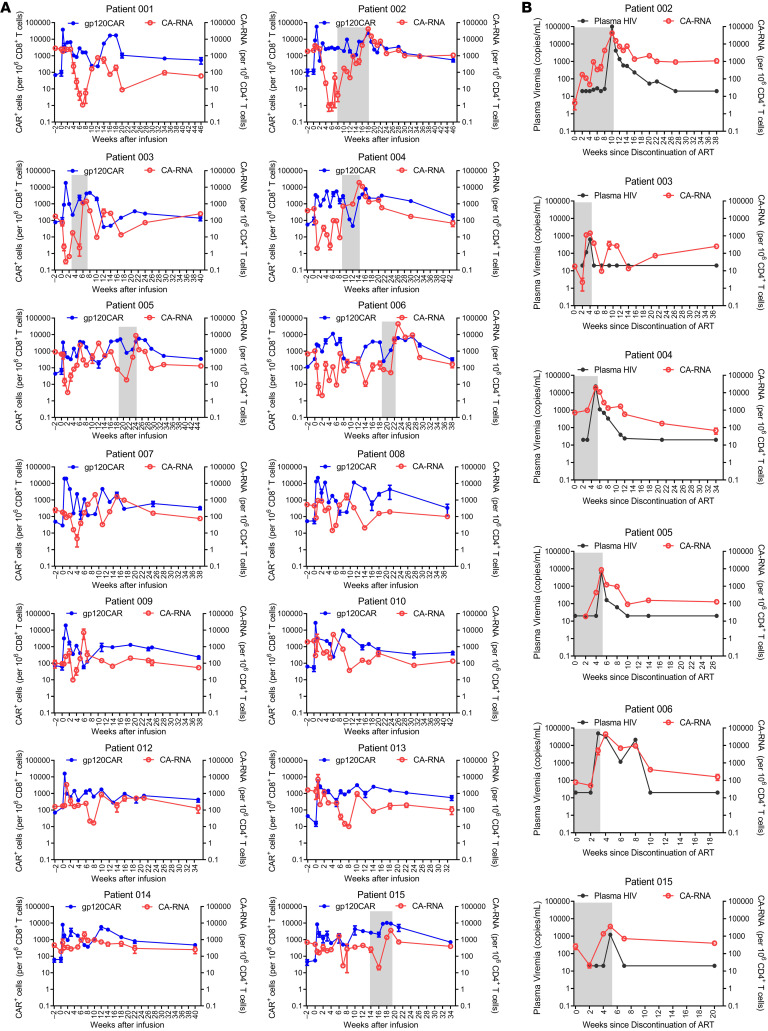
Figure 3. Cell-associated viral RNA and in vivo CAR T cell persistence before and after adoptive transfer.
(A) Measured CAR+ cell concentrations (per million CD8+ T cells) for the 14 enrolled patients are shown in blue (log10 scale on left), and CA-RNA levels after adoptive transfer (per million CD4+ T cells) are shown in red (log10 scale shown on right). ATI period is shown by shades of gray. (B) HIV-1 RNA levels in plasma (copies/mL) are shown in black (log10 scale shown on right) and CA-RNA levels after ATI (per million CD4+ T cells) are shown in red (log10 scale shown on left). ATI periods are shown by shades of gray.

