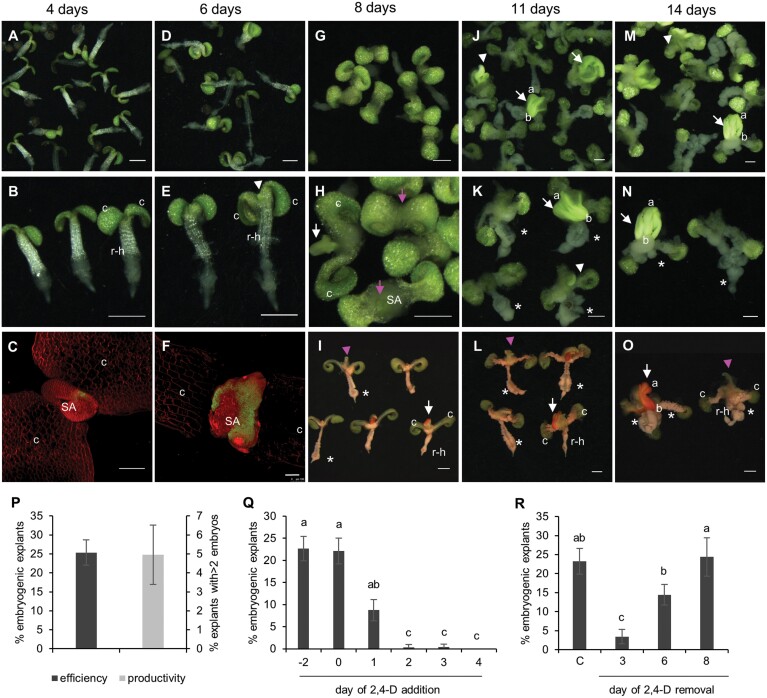
Fig. 1.
2,4-D-induced somatic embryogenesis (SE) from wild-type mature after-ripened embryo explants. The time of culture is indicated above the panels. (A–N) Overview of somatic embryo cultures in time. (B, E, H, K, N) Magnified images. The images are light micrographs. (C, F) LEC1:LEC1-GFP explant showing LEC1–GFP expression (green) at the shoot apex. The explants were counterstained with FM4-64 (red). The images are confocal laser scanning micrographs. (I, L, O) Sudan Red-stained explants. Sudan Red stains the bright green structures and embryos at the shoot apex, but not the ectopic leaf-like structure that develops at the shoot apex of non-embryogenic explants. The images are light micrographs. (A–O) c, cotyledon; r-h, root–hypocotyl; a, apical pole; b, basal pole; white arrowhead, embryogenic structures; white arrow, somatic embryos; pink arrowhead, leaf-like structure; pink arrow, non-embryogenic shoot apex; asterisk, callus. The scale bars are 1 mm in (A), (B), (D), (E), and (G–O), and 100 µm in (C) and (F). (P) Somatic embryogenesis efficiency (percentage of explants with embryogenic tissues and/or bipolar embryos) and productivity (percentage of explants with >2 bipolar embryos) from germinating seeds. (Q) Effect of 2,4-D addition on SE. 2,4-D was added during stratification (–2), at the start of culture (0), or at the indicated time points (1–4) after the start of cultures. (R) Effect of 2,4-D removal on SE induction. 2,4-D was added during stratification (–2) and then removed at the indicated time points by refreshing the medium. C, continuous 2,4-D treatment was used as a control. For (Q) and (R), statistically significant differences in SE efficiency were calculated using Fisher’s least significant difference test. Error bars represent the SD of three technical replicates in one experiment.

