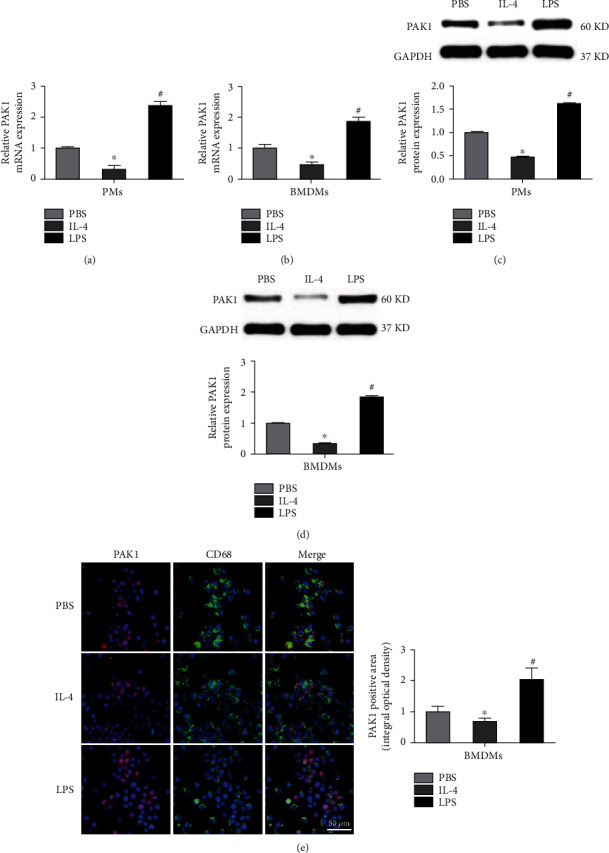
Figure 1.

PAK1 expression is induced in M1 but reduced in M2 macrophages. (a, b) PAK1 mRNA levels in PMs and BMDMs subjected to PBS, IL-4, or LPS stimulation for 24 hours. n = 3. (c, d) Western blot analysis of PAK1 protein levels in PMs and BMDMs administrated with PBS, IL-4, or LPS for 24 hours. n = 3. (e) Representative images of double immunofluorescence staining of BMDMs with an anti-PAK1 antibody (red) and macrophage marker (CD68, green) treated with PBS, IL-4, or LPS for 24 hours. The integral optical density of PAK1 was presented. Scale bar = 50 μm. n = 3. ∗P < 0.05 versus PBS group, #P < 0.05 versus IL-4 group. PMs: peritoneal macrophages; BMDMs: bone marrow-derived macrophages; PBS: phosphate-buffered saline; IL-4: interleukin-4; LPS: lipopolysaccharides.
