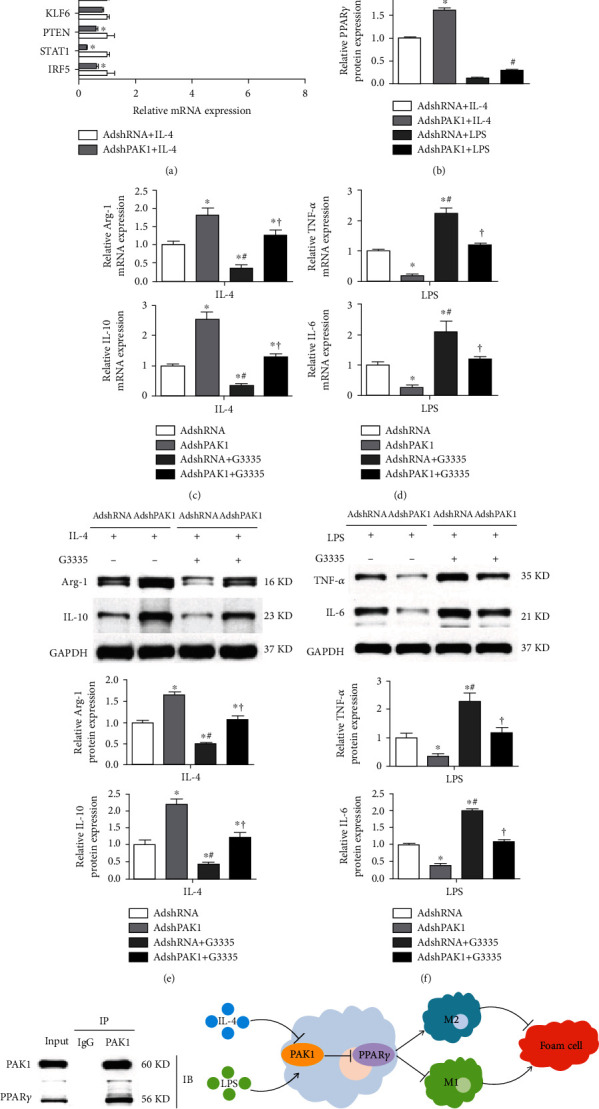
Figure 5.

Upregulated PPARγ expression by PAK1 silencing. (a) mRNA levels of the representative regulators for macrophage polarization in BMDMs by PAK1 knockdown with IL-4 stimulation. n = 3. ∗P < 0.05 compared with AdshRNA group. (b) Protein level of PPARγ in BMDMs by PAK1 knockdown with IL-4 or LPS stimulation. n = 3. ∗P < 0.05 or #P < 0.05 compared with control group. (c–f). RT-PCR (c, d) and Western blot (e, f) analysis of M2 and M1 marker gene expression in macrophage transfected with AdshRNA or AdshPAK1 and treated with LPS or IL-4, which then cultured with G3335 or control. n = 3. ∗P < 0.05 compared with AdshRNA group; #P < 0.05 vs. AdshPAK1 group; †P < 0.05 vs. AdshRNA with G3335 group. (g) Immunoblotting with PPARγ or PAK1antibody was performed on co-IP of PAK1 using PAK1 antibody. (h) Schematic diagram of the molecular mechanisms underlying PAK1-regulated macrophage polarization and foam cell. PPARγ: peroxisome proliferator-activated receptor γ.
