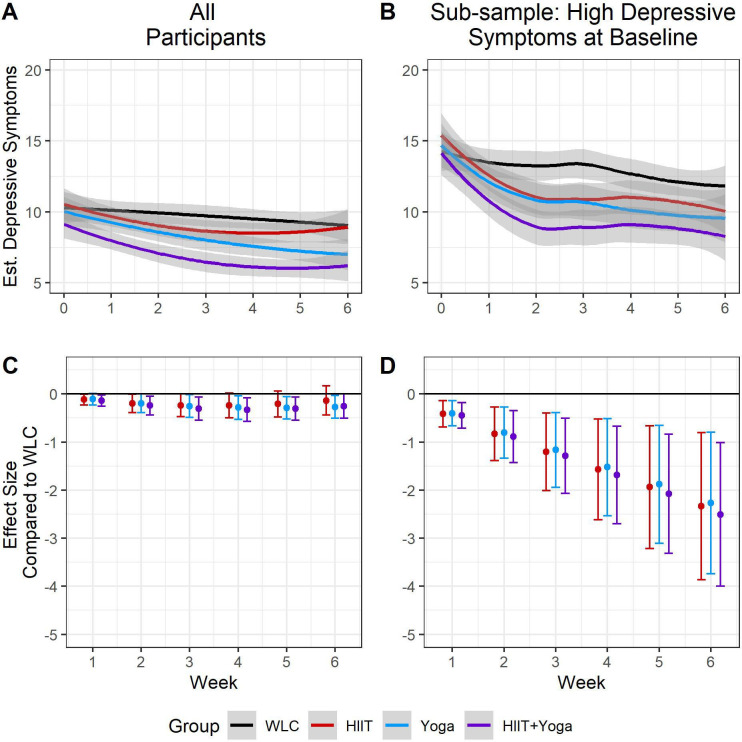
Figure 3.
Trajectories and effect sizes for depressive symptoms over the course of the study. Note: figure 3A shows each group’s trajectories, in the full sample, while figure 3B show the trajectories for those with high (CESD score ≥10) levels of depressive symptoms. Figure 3C, D represent the effect sizes at each time point, for all participants and those with high levels of depressive symptoms, respectively. CESD, Center for Epidemiological Studies – Depression Scale; HIIT, high intensity interval training; WLC, waitlist control.

