FIGURE 6.

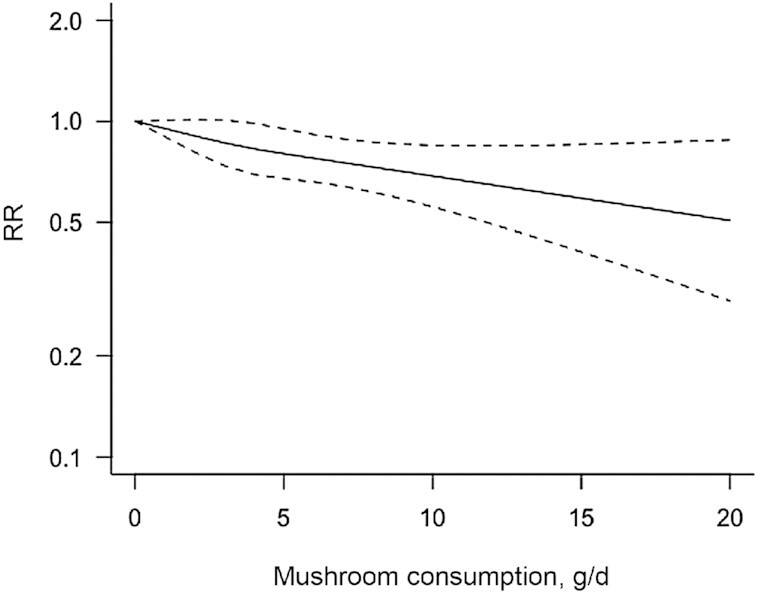
Dose–response associations of mushroom consumption and cancer risk. The solid lines represent the best-fitting cubic spline and the dotted lines represent the 95% CIs.

Dose–response associations of mushroom consumption and cancer risk. The solid lines represent the best-fitting cubic spline and the dotted lines represent the 95% CIs.