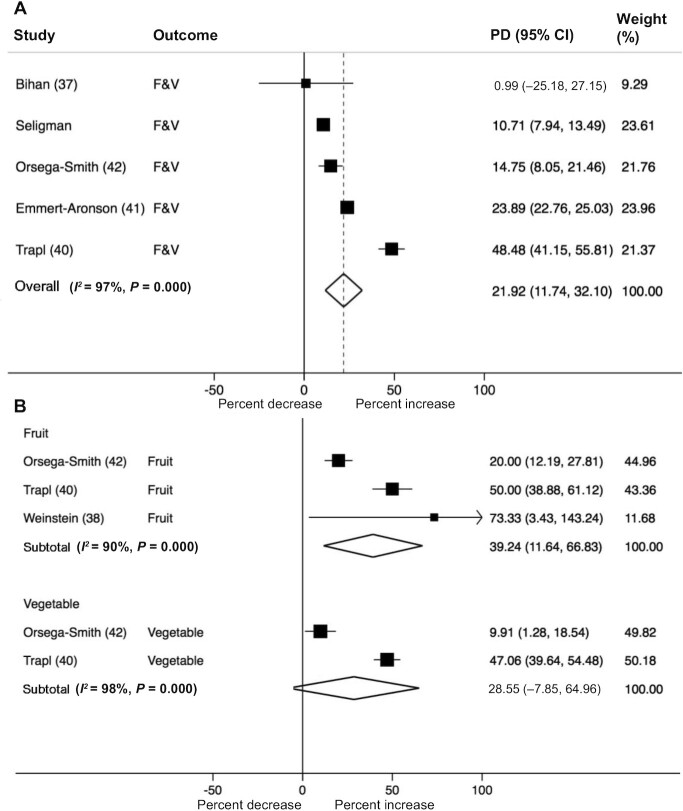
FIGURE 2.
Forest plot illustrating the change in fruit and/or vegetable intake per day (percentage difference, PD) following participation in healthy food prescription programs. Fruit and vegetable (F&V) intake was reported both as a composite variable (A) and separately (B). Data were pooled using random effects meta-analysis.

