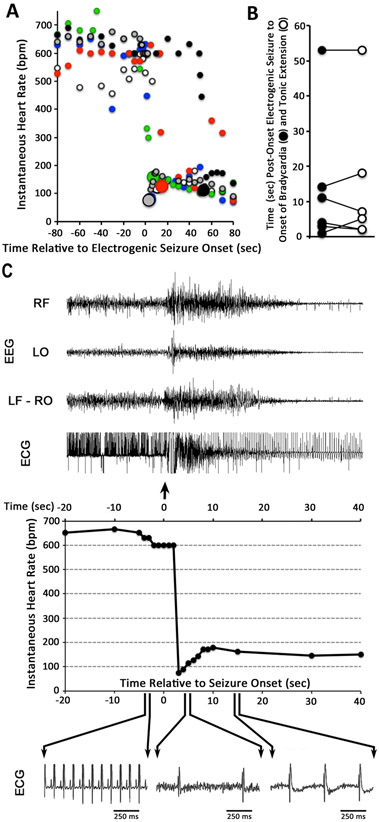
Figure 3. Sudden bradycardia at onset of terminal seizures in Fhf1R52H/+ mice.
A) Instantaneous heart rates upon seizures. Heart rates for each of six Fhf1R52H/+ mice are marked with different color circles before and after the onset of electrogenic seizure (time = 0). All lethal seizures were accompanied by abrupt decline in heart rate to ≤160 bpm, which is marked by a larger diameter circle occuring in these mice at 3, 4, 7, 11, 15 or 53 seconds post-onset of seizure. B) Coincidence of tonic extension and bradycardia onset. For each of the six Fhf1R52H/+ mice described in (A), the time of bradycardia onset (closed circle) and tonic extension (open circle) are plotted and linked. Bradycardia and tonic extension always commenced within four seconds of one another, despite the wide temporal variability of these events relative to electrogenic seizure onset. C) Abrupt suppression of cardiac rhythm by terminal seizure in a Fhf1R52H/+ mouse. Top: EEG and ECG traces from twenty seconds prior to forty seconds after seizure onset. The EEG channel designations are the same as described in Figure 2. The tonic seizure superimposes electromyographic noise on the ECG signal. Middle: Graph of instantaneous heart rate over the same time period as above shows abrupt drop in heart rate within three seconds of seizure onset. Bottom: One-second time-scale enlargements of the ECG trace 4 seconds before and 4 or 14 seconds after seizure onset. The ECG waveform after bradycardia onset lacks detectable P waves, suggesting ventricular beats.

