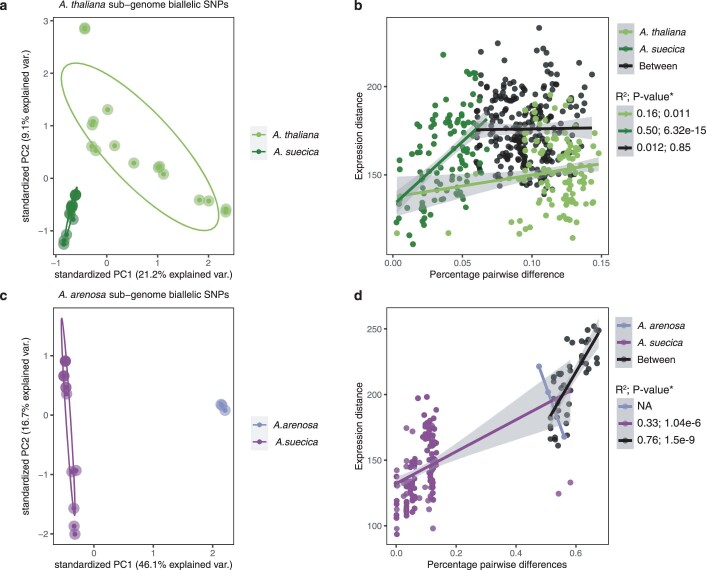
Extended Data Fig. 8. Comparison of genetic and expression distance.
a, PCA plot of biallelic SNPs in the population of A. thaliana and A. suecica for the A. thaliana subgenome of A. suecica (N=345,075 biallelic SNPs), of the analysed 13,647 genes in gene expression in addition to 500 bp up and downstream of each gene sequence b, Correlation of 𝜋 (pairwise genetic differences) and expression distance (that is, euclidean distance) for 14,041 genes (*=Bootstrapped 1000 times). c, PCA plot of biallelic SNPs in the population of A. arenosa (N.B. we had DNA sequencing for only 3 of the 4 accessions used in the expression analysis) and A. suecica for the A. arenosa subgenome of A. suecica (N= 1,761,708 biallelic SNPs), of the analysed 14,041 genes in gene expression in addition to 500 bp up and downstream of each gene sequence d, Correlation of Pi (pairwise genetic differences for mapped genomic regions) and expression distance (that is, euclidean distance) for 14,041 genes (*=Bootstrapped 1000 times). A. arenosa was too few samples to give reliable correlations and therefore is NA. Grey bars represent the 95 confidence intervals.

