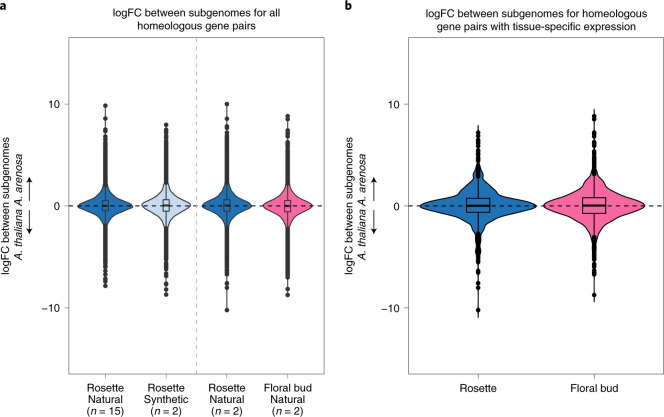
Fig. 4. Patterns of gene expression between the subgenomes of A. suecica in rosettes and floral buds.
a, Violin plots of the mean log fold change (logFC) between the subgenomes for the 15 natural A. suecica accessions and 2 synthetic lines for whole rosettes. The centre line is the 50th percentile or median. The box limits represent the interquartile range. The whiskers represent the largest and smallest value within 1.5 times the interquartile range above and below the 75th and 25th percentile, respectively. Mean log fold change for the two accessions (ASS3 and AS530) for which transcriptome data for both whole rosettes and flower buds were available. All the distributions are centred around zero, suggesting even subgenome expression. b, Violin plots for the mean log fold change between the subgenomes for gene pairs with tissue-specific expression in at least one member of the pair.

