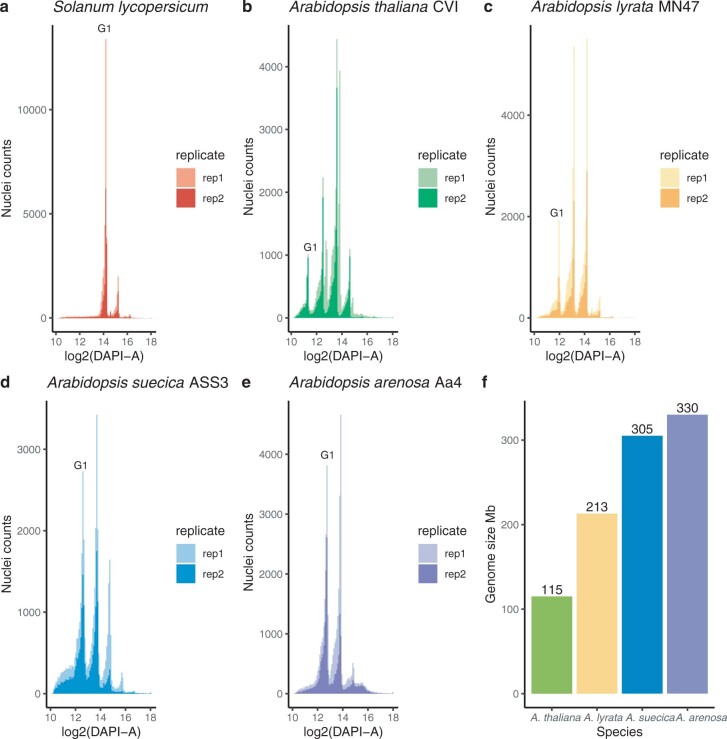
Extended Data Fig. 1. Measuring genome sizes of Arabidopsis species using flow cytometry.
a, FACS sorting of Solanum lycopersicum cells from 3-week-old leaf tissue for two replicates. G1 represents the peak denoting the G1 phase of the cell cycle. Cells in the G1 phase have 2 C DNA content (that is a 2 N genome). b, A. thaliana ‘CVI’ accession c, A. lyrata ‘MN47’ (the reference accession) d, A. suecica ‘ASS3’ (the reference accession) e autopolyploid A. arenosa accession ‘Aa4’ f, Bar chart shows calculated genome sizes (rounded to the nearest whole number) for each species using Solanum lycopersicum as the standard.

