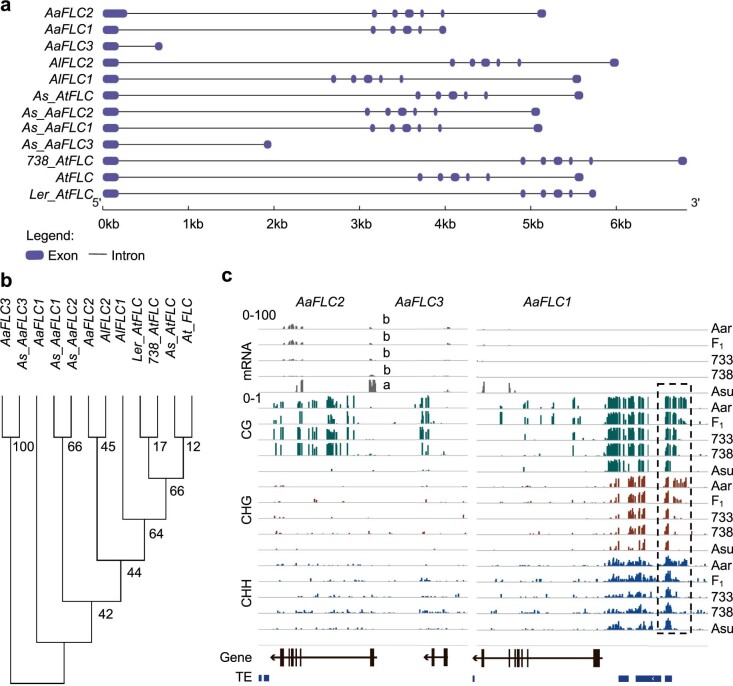
Extended Data Fig. 5. Comparative genomics of FLC loci in A. suecica and related species.
a, Gene structure of FLC in different species: A. thaliana (Col, AtFLC; Ler_AtFLC), T subgenome of Allo738 (738_AtFLC), A subgenome (Aar) (AaFLC1, AaFLC2, AaFLC3), A. suecica (As_AaFLC1, As_AaFLC2, As_AaFLC3), A. lyrata (AlFLC1 and AlFLC2). b, Phylogenetic tree of FLC genes. c, CG, CHG and CHH methylation and mRNA expression patterns of FLC genes and their vicinity in A (Aar), F1, 733, 738 and A. suecica (Asu). The y axis scales shown above gBrowse tracks indicate mRNA (1–100) and methylation (0–1) levels. Differentially methylated regions are shown in a dashed box. Shown below are diagrams of three FLC loci (arrows indicating transcription direction) and TEs. Different letters in mRNA (TPM) indicate statistical significance of P < 0.05 (ANOVA test, n = 3).

