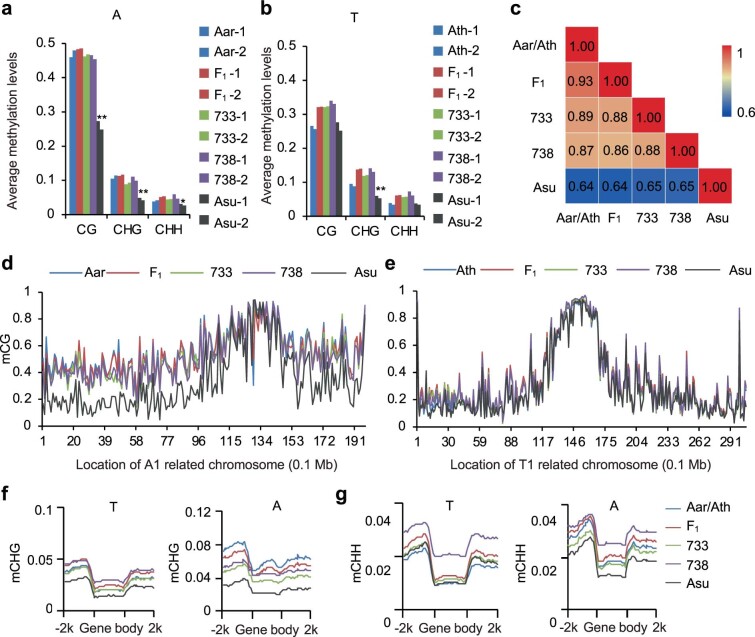
Extended Data Fig. 6. DNA methylation levels in F1, Allo733 (733), Allo738 (738) and A. suecica (Asu) allotetraploids and their related progenitors (Aar and Ath Ler4).
a, b, Average methylation levels with two biological replicates in A (a) and T (b) related genomes or subgenomes in allotetraploids. Two asterisks indicate statistical significance level of P < 0.01 (Mann–Whitney U-test). c, Heatmap of pairwise comparisons between correlation coefficients of methylated cytosines in CG context of Aar, Ath Ler4 (T), and respective subgenomes of F1, 733, 738 and Asu. d, e, CG methylation levels in A1 (d) or T1 (e) related chromosomes of A. arenosa (Aar), A. thaliana (Ath Ler4), F1, Allo733 (733), Allo738 (738), and A. suecica (Asu). f, g, CHG and CHH methylation levels in genic regions of Ath Ler4 (T) and Aar (A) relative to respective subgenomes in allotetraploids (F1, Allo733, Allo738, and Asu).

