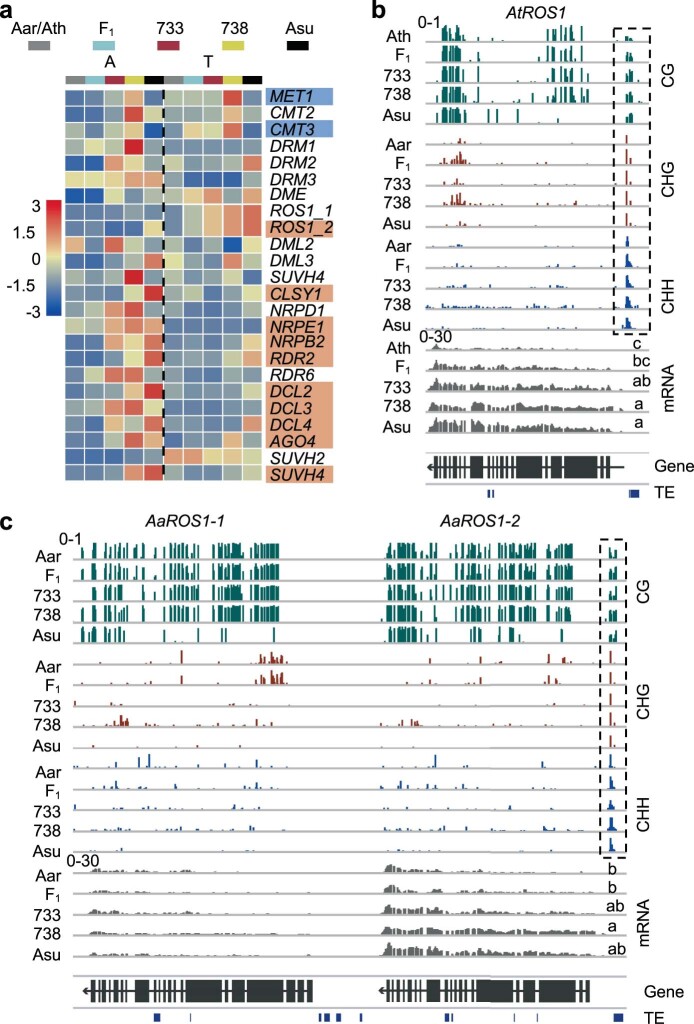
Extended Data Fig. 8. Differential expression of methylation pathway genes including AtROS1, AaROS1–1 and AaROS1–2 in allotetraploids.
a, Heatmap of transcript levels (TPM: transcripts per kilobase per million) of methylation pathway genes in A and T subgenomes of Arabidopsis allotetraploids, respectively. From parents (Aar/Ath) to A. suecica (Asu), the upregulated genes was marked orange, while down-regulated genes was marked blue. b, c, gBrowse tracks showing CG (green), CHG (red), and CHH (blue) methylation and mRNA expression (grey) levels in AtROS1 (b) and AaROS1–1 and AaROS1–2 (c) genes and their vicinity in A. thaliana (Ath) and A. arenosa (Aar), F1, 733, 738 and A. suecica (Asu). The regions associated with a TE in the 5′ sequence are shown in a dashed box. The y axis scales shown above the gBrowse tracks indicate mRNA (0–30) and methylation (0–1) levels. Different letters in mRNA (TPM) indicate statistical significance of P < 0.05 (ANOVA test, n = 3).

