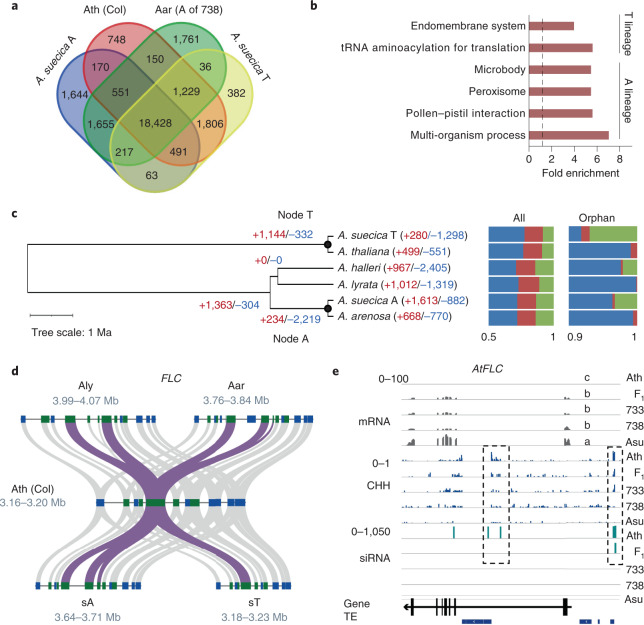
Fig. 2. Gene family expansion and contraction.
a, Venn diagram of orthologue clusters among A. thaliana (Ath, Col), A. arenosa (A subgenome of 738) and A. suecica (sT and sA subgenomes). b, GO enrichment terms of the genes specific to T lineage (Col, sT subgenome of A. suecica) and A lineage (A. arenosa, sA subgenome of A. suecica, A. lyrata, A. halleri). Dashed line indicates onefold enrichment. c, Expansion and contraction of gene families in Arabidopsis-related species with the numbers in parenthesis, indicating gene families subject to expansion (+red) and contraction (–blue), respectively. Black dots indicate node T (ancestor of A. thaliana) and node A (ancestor of A. arenosa), respectively. Bar graphs show the proportion of single-copy (blue), two-copy (red) and multi-copy (green) genes among all (All) and orphan (Orphan) genes in corresponding species. d, Micro-colinearity patterns between FLC and flanking genes in Col, Aar (A subgenome of 738), A. suecica (sT and sA subgenomes) and A. lyrata (Aly). Ribbons indicate colinearity of FLC genes (purple) and its flanking genes (grey). e, FLC expression is correlated with CHH methylation and siRNA levels in A. thaliana (Ath), F1, resynthesized allotetraploids (Allo733 and Allo738) and natural A. suecica (Asu). Scales indicate mRNA (0–100), CHH methylation density (0–1) and 24-nucleotide siRNA (0–1,050) levels. Different letters in mRNA (transcripts per kilobase million) indicate statistical significance of P < 0.05 (analysis of variance (ANOVA) test, n = 3).

