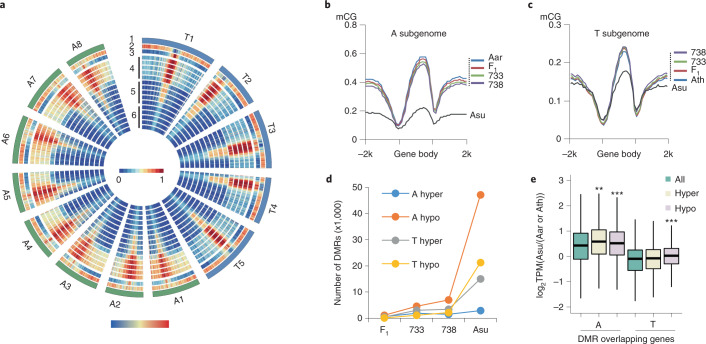
Fig. 3. DNA methylation dynamics during the formation and evolution of allotetraploid Arabidopsis.
a, Chromosome features and methylation distributions. Notes in circos plots: (1) chromosomes, (2) gene and (3) TE density and (4) CG, (5) CHG and (6) CHH methylation levels using 100-kb windows in Ath (Ler4) or Aar, F1, Allo733, Allo738 and A. suecica (in that order from outside to inside in each methylation context). Note that strain identity is omitted in naming T and A chromosomes. b,c, CG methylation levels in the gene body and flanking (2-kb) sequences of the A (b) and T (c) subgenomes in F1, Allo733 (733), Allo738 (738) and A. suecica (Asu), relative to A. thaliana (Ath) and A. arenosa (Aar), respectively. d, Numbers of DMRs between T subgenome and Ath (Col) or A subgenome and Aar in F1, 733, 738 and Asu, respectively. e, Expression ratio log2TPM(Asu/(Aar or Ath)) of the genes flanking a 2-kb region of hypo- or hyper-DMRs between A. suecica (Asu) and A. arenosa (Aar) or A. thaliana (Ath, Ler4). Three asterisks indicate a statistical significance level of P < 0.001 (Mann–Whitney U-test). TPM, transcripts per kilobase per million.

