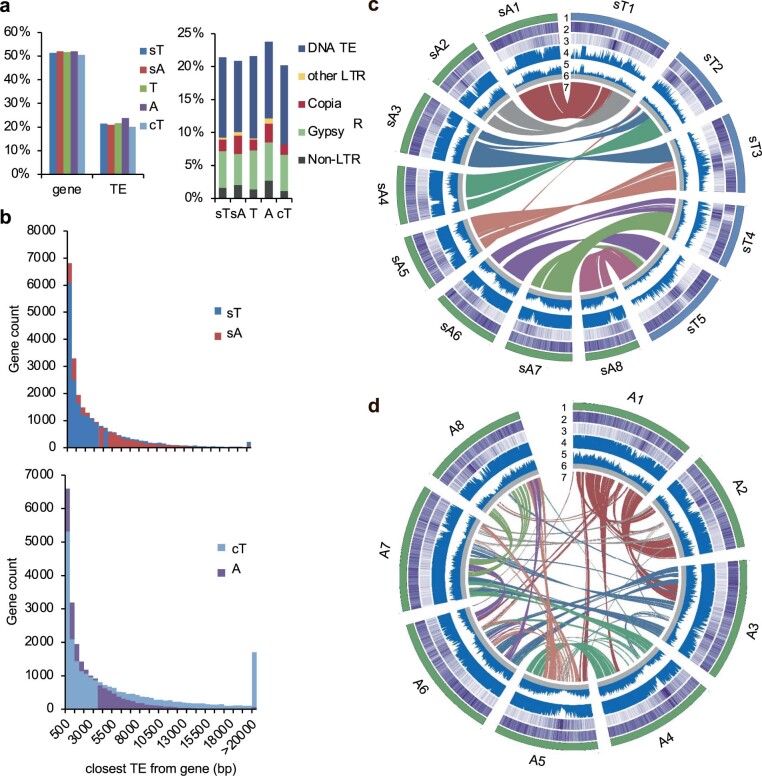
Extended Data Fig. 1. Synteny and gene content of two subgenome in A. suecica.
a, Proportion of genes and TEs (left) and TE classes (right) in A. thaliana (Col) and in A and T subgenomes of Allo738 (738) and sA and sT subgenome of A. suecica (Asu). b, Distances of the nearest TE from each gene in sT and sA subgenomes of Asu (upper panel) and in Col (cT) and A subgenome (Aar-related) of Allo738 (lower panel). c, d, Genomic features of A. suecica (c) and A. arenosa (d) genome. (1) Chromosome ideogram; (2) Gene density; (3) TE density; (4)-(6) SNP (4), indel (5) identity, and aligned regions (6) between A. suecica and Col or A (c) or between A and A. lyrata genomes (d); (7) synteny of sA and sT homologous gene pairs (c) or paralogous gene pairs (d). Colours in (1) indicate T (blue) and A (green) or related subgenomes; colour scales in (2) and (3) indicate high (dark purple) to low (white) density; densities (2)-(5) were shown per 100-kb windows; only gene pairs in syntenic blocks spanning 30 genes were shown in (7).

