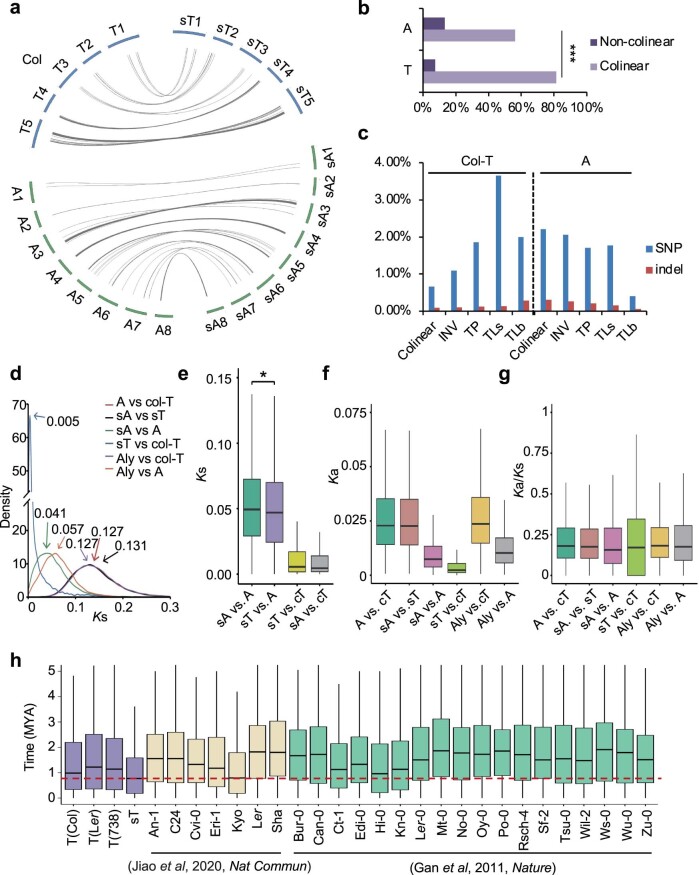
Extended Data Fig. 3. Genomic variation between A. suecica, A. thaliana, and A. arenosa genomes.
a, Inversions between sT of Asu and Col-T (Ath) or between sA of Asu and A (Ara-related) of Allo738. b, Proportion of co-linear and non-co-linear regions between A and T. Three asterisks indicate statistical significance level of P < 0.001 (Fisher’s exact test). c, Proportion of SNP and indel distributions in sA and sT subgenomes of Asu relative to A and cT genomes. Non-co-linear: not collinear; INV: inversion; TP: transpositions; TLs: translocations within a subgenome; TLb: translocations between T and A subgenomes. d, Distribution of Ks values for a set of 14,668 single-copy genes among A subgenome (Aar-related) of 738, cT (Ath, Col), sT and sA subgenomes of Asu, and A. lyrata (Aly). e, Distribution of Ks values between genes in co-linear and TLb regions (co-linear regions: sA vs A, sT vs cT; TLb regions: sT vs A, sA vs cT). One asterisk indicates statistical significance level of P < 0.05 (Mann–Whitney U-test). f, Distribution of Ka values between A and col-T (cT), A. lyrata (Aly), and sT and sA subgenomes of Asu. g, Distribution of Ka/Ks values as in (f). h, Boxplots of the estimated time (million years ago, MYA) for intact LTR insertions in 25 A. thaliana ecotypes. The red dashed line indicates the median of time in sT (ANOVA test).

