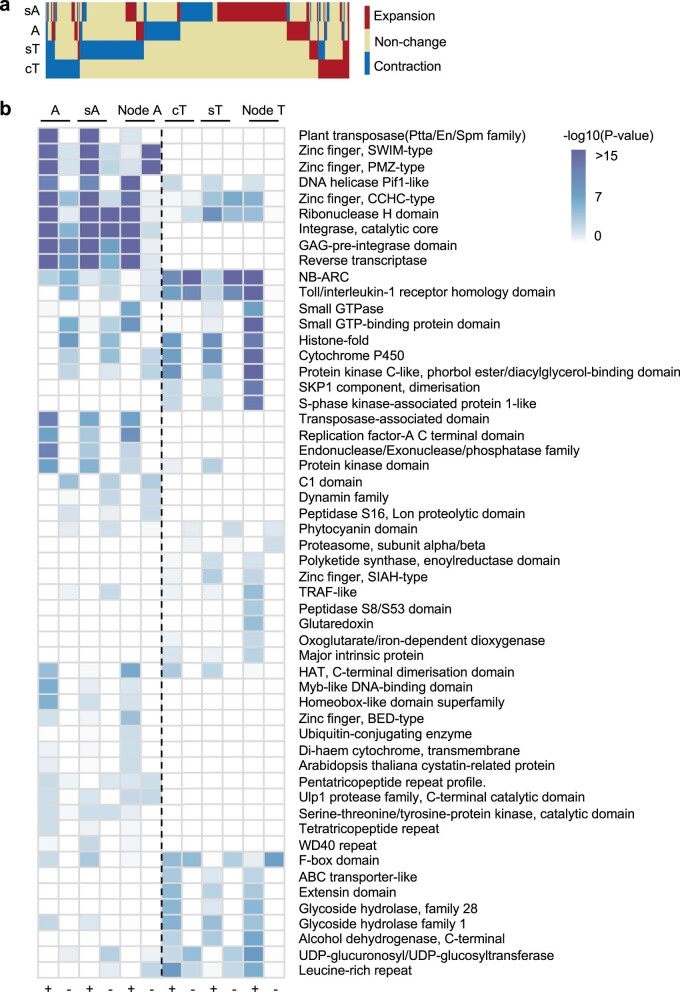
Extended Data Fig. 4. Expansion and contraction of gene families in A and T-related genomes.
a, Heatmap showing expansion and contraction of gene families in A subgenome (Aar-related) of Allo738, Col-T (cT), and sA and sT subgenomes of A. suecica. b, Domain enrichment of gene family expansion/contraction (+/-) in A, sA, and their nearest ancestor (Node A in Fig. 2c), and cT, sT, and their nearest ancestor (Node T in Fig. 2c) (Fisher’s exact test).

