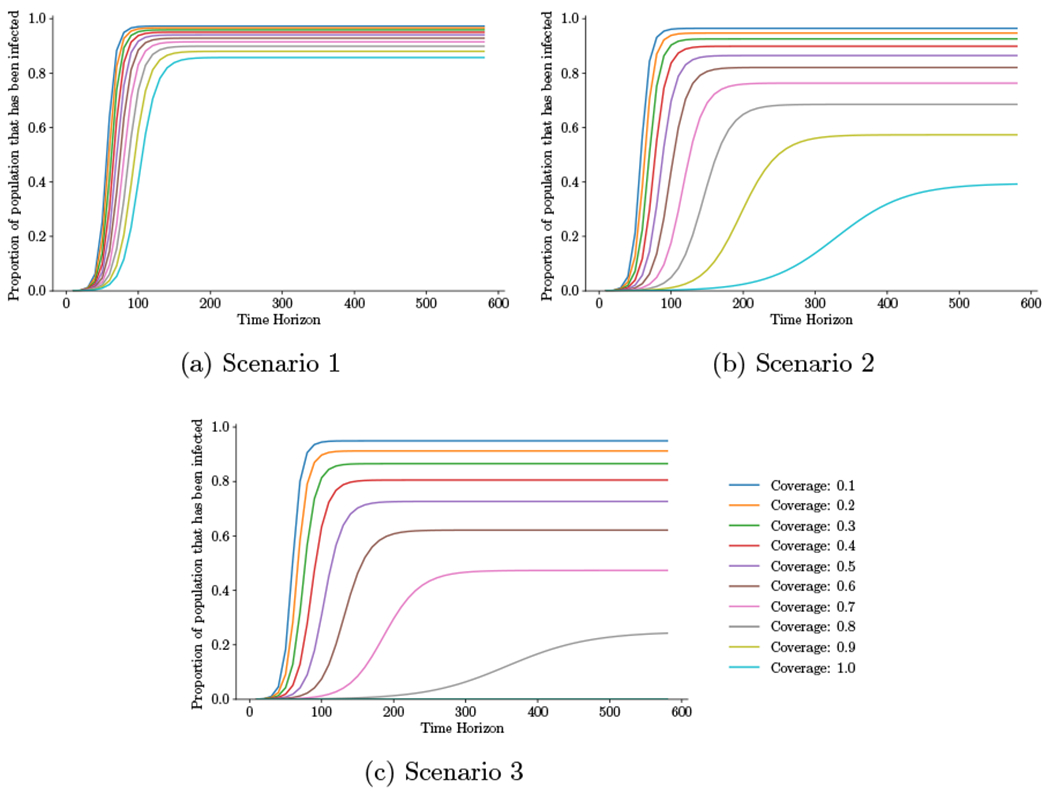
Figure 5:

Initial outbreak. Proportion of the population that has been infected for different time horizons (ranging from 10 to 600 days in 10 day increments) as a function of coverage level, assuming immediate intervention. Scenario 1: ηS = 0.2, ηI1 = 0.3; Scenario 2: ηS = 0.4, ηI1 = 0.5; Scenario 3: ηS = 0.6, ηI1=0.7, where ηS = reduction in susceptibility for an uninfected person wearing a mask, ηI1 = reduction in infectivity for an unconfirmed infected person wearing a mask.
