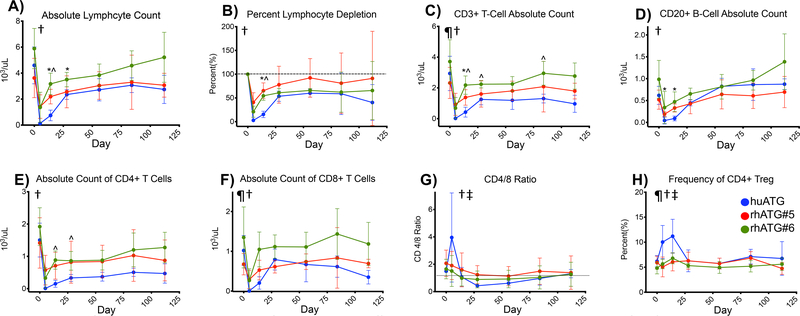
Figure 2:
All ATGs cause depletion but huATG causes more efficient depletion, greater changes in the CD4/8 Ratio and greater increases in Treg. A) Absolute and B) percent lymphocytes stratified by ATG preparation. Absolute counts of C) CD3+ T Cells, D) CD20+ B Cells, E) CD4+ T cells and F) CD8+ T cells stratified by ATG preparation. G) CD4/8 ratio as stratified by ATG preparation. H) Frequency of CD4+ Treg stratified by ATG preparation. All comparisons by mixed effects model comparing for the main effects of treatment, time and interaction of treatment and time with Dunnett’s post-test for comparison of huATG vs. rhATG#5 or rhATG#6. ¶= p<0.05 for treatment, †=p<0.05 for time, and ‡=p<0.05 for interaction of treatment and time. *=p<0.05 for huATG vs. rhATG#5, ^=p<0.05 for huATG vs. rhATG#6.

