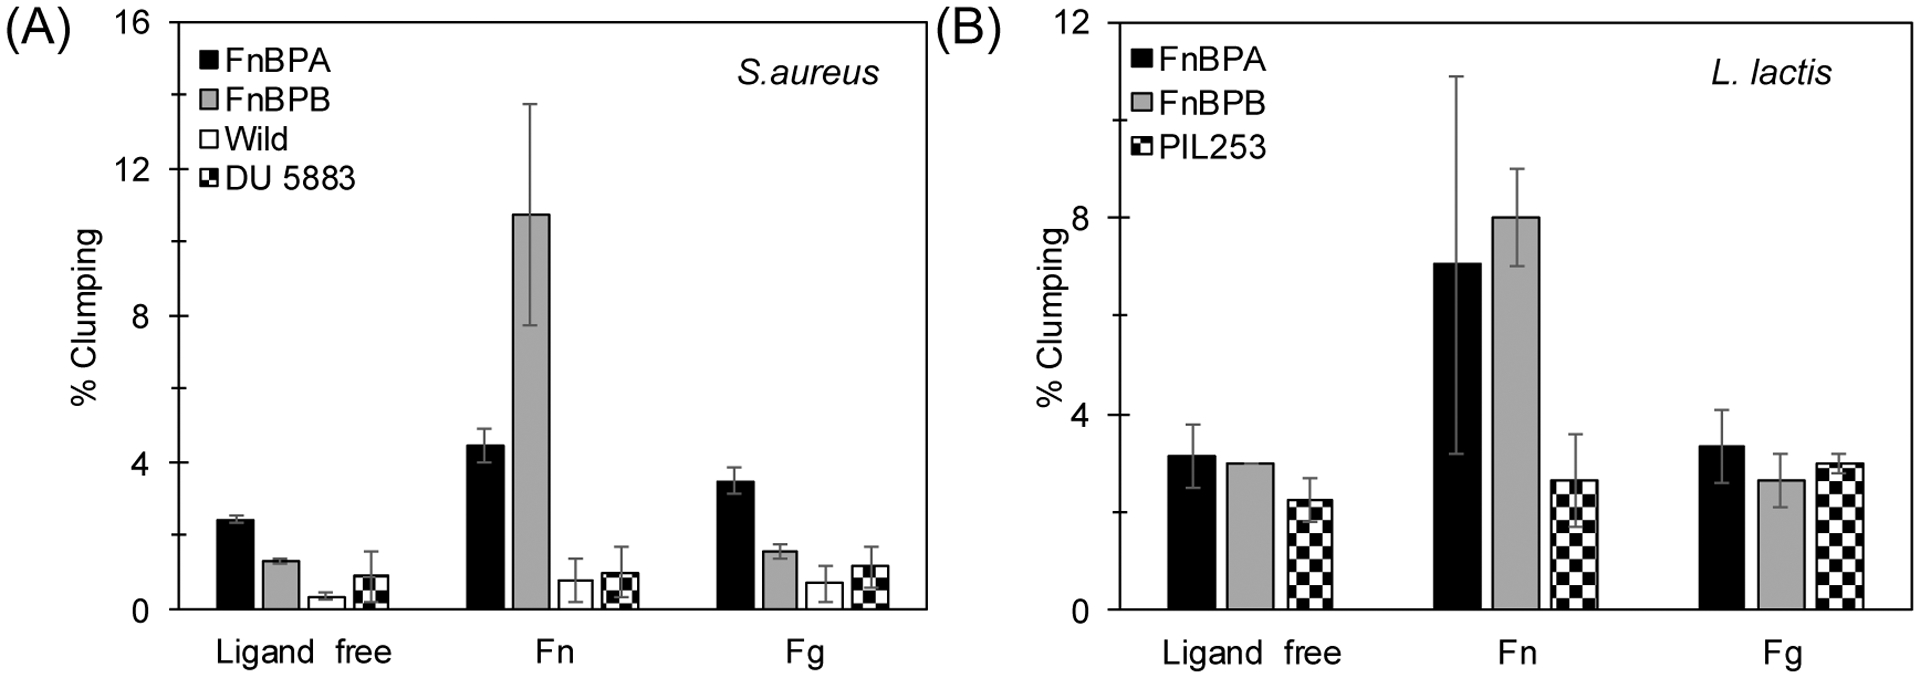
Figure 4.

Aggregation of (A) S. aureus and (B) L. lactis after 1 hr incubation under static conditions determined by flow cytometry. Results shown are the means ± standard deviation of at least three independent experiments. For every experiment, an independent, fresh preparation of each strain was used. p-values were calculated using t-test where p < 0.05 is indicated by *.
