
Extended Data Figure 6. Optogenetic inhibition of pPVT–CeA axon terminals in the 2AA task.
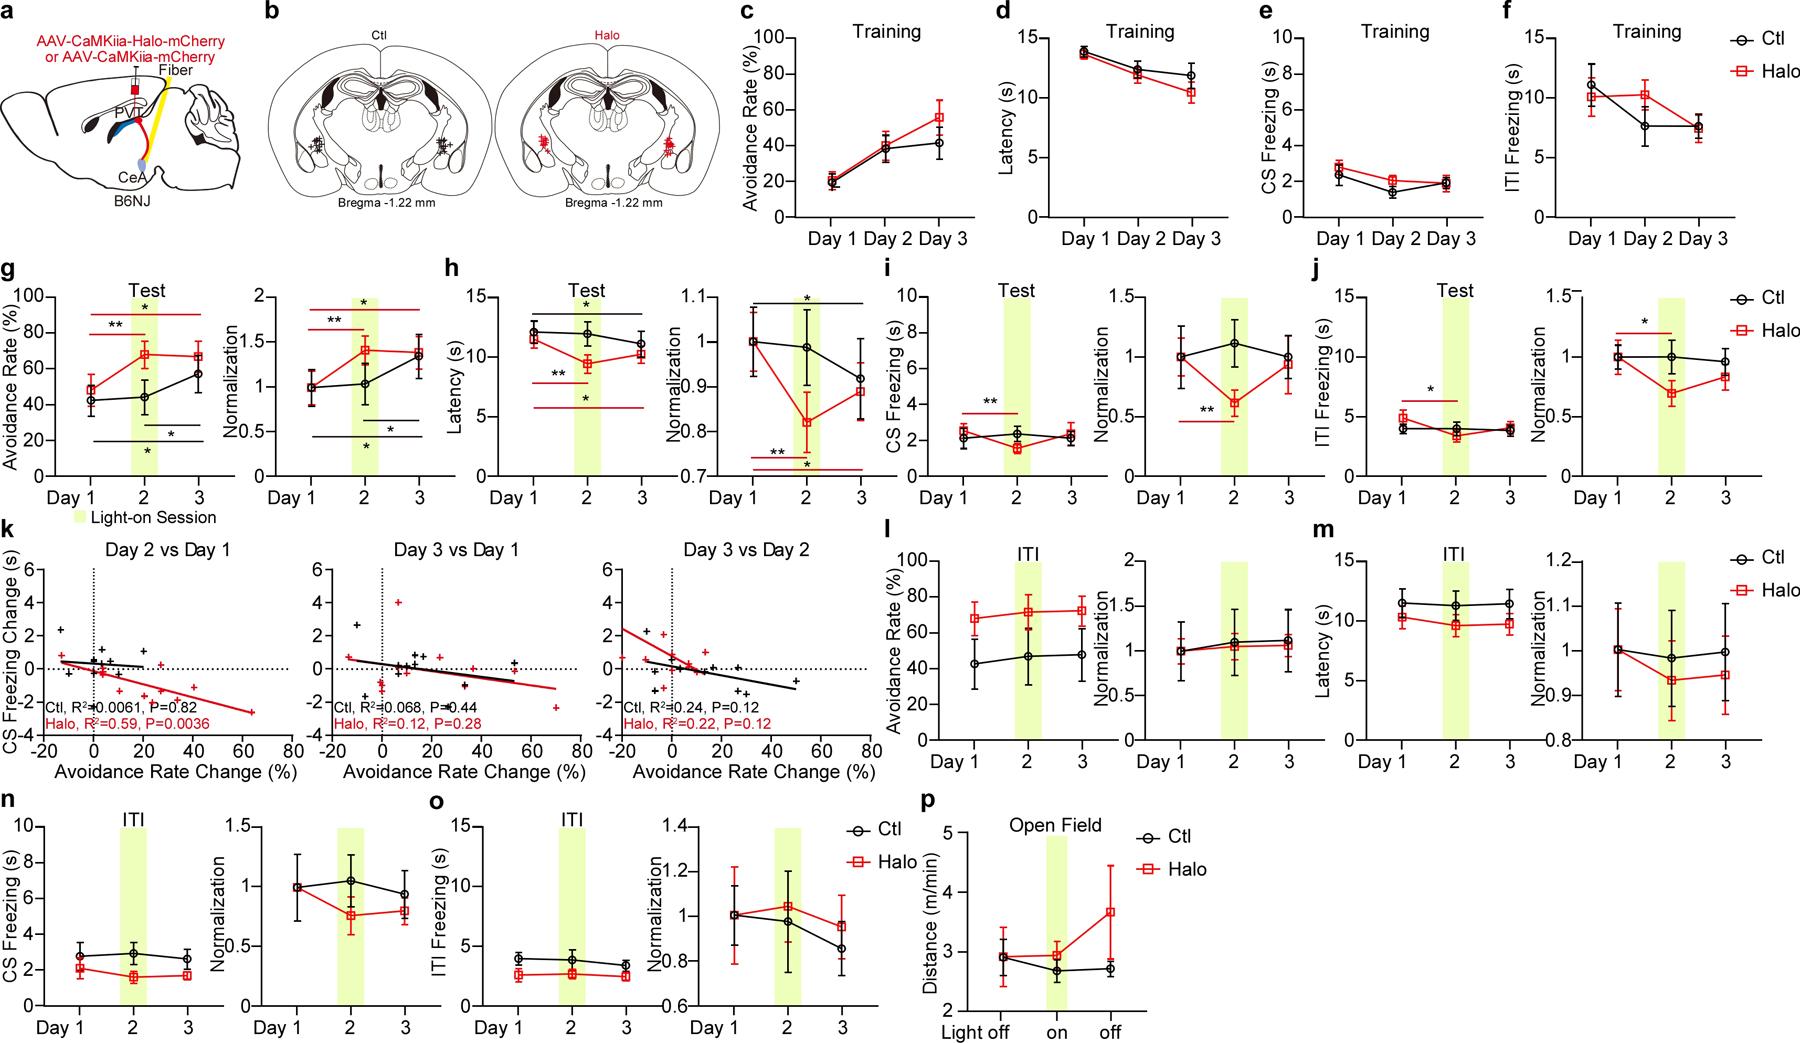
a, Schematic of the viral vector strategy and optical fiber placement for optogenetic silencing of pPVT–CeA axon terminals in the 2AA task. b, Fiber placements (Ctl, n = 11 mice; Halo, n = 12 mice). c-f, Avoidance rate (c), latency to avoid (d) and freezing time during the CS (e) and ITI (f) across training sessions for each group. g-j, Left: Avoidance rate (g), latency to avoid (h) and freezing time during the CS (i) and the ITI (j) of optogenetic inhibition of pPVT–CeA axon terminals. Right: Normalization to Day 1 for each group. Two-way ANOVA followed by two-stage linear step-up procedure of Benjamini, Krieger and Yekutieli. Avoidance rate: F(2, 42) = 3.27. Latency to avoid: F(2, 42) = 5.35. CS freezing: F(2, 42) = 2.77. ITI freezing: F(2, 42) = 1.67. For group comparisons **P < 0.01, *P < 0.05. k, Linear regression of the changes in freezing behavior across test sessions as a function of changes in avoidance behavior. l-o, Left: Avoidance rate (l), the latency to avoid (m) and freezing time during the CS (n) and the ITI (o) during optogenetic inhibition of pPVT–CeA axon terminals during the ITI. Right: Normalization to Day 1 for each group. Ctl, n = 6 mice; Halo, n = 10 mice. Two-way ANOVA followed by two-stage linear step-up procedure of Benjamini, Krieger and Yekutieli. Avoidance rate, F(2 ,28) = 0.0052; latency to avoid, F(2, 28) = 0.22; CS freezing, F(2, 28) = 0.61; ITI freezing, F(2, 28) = 0.086; non-significant change among each group comparison. p. Moving distance in the open field. Ctl, n = 8 mice; Halo, n = 9 mice. All data in figure shown as mean ± s.e.m.