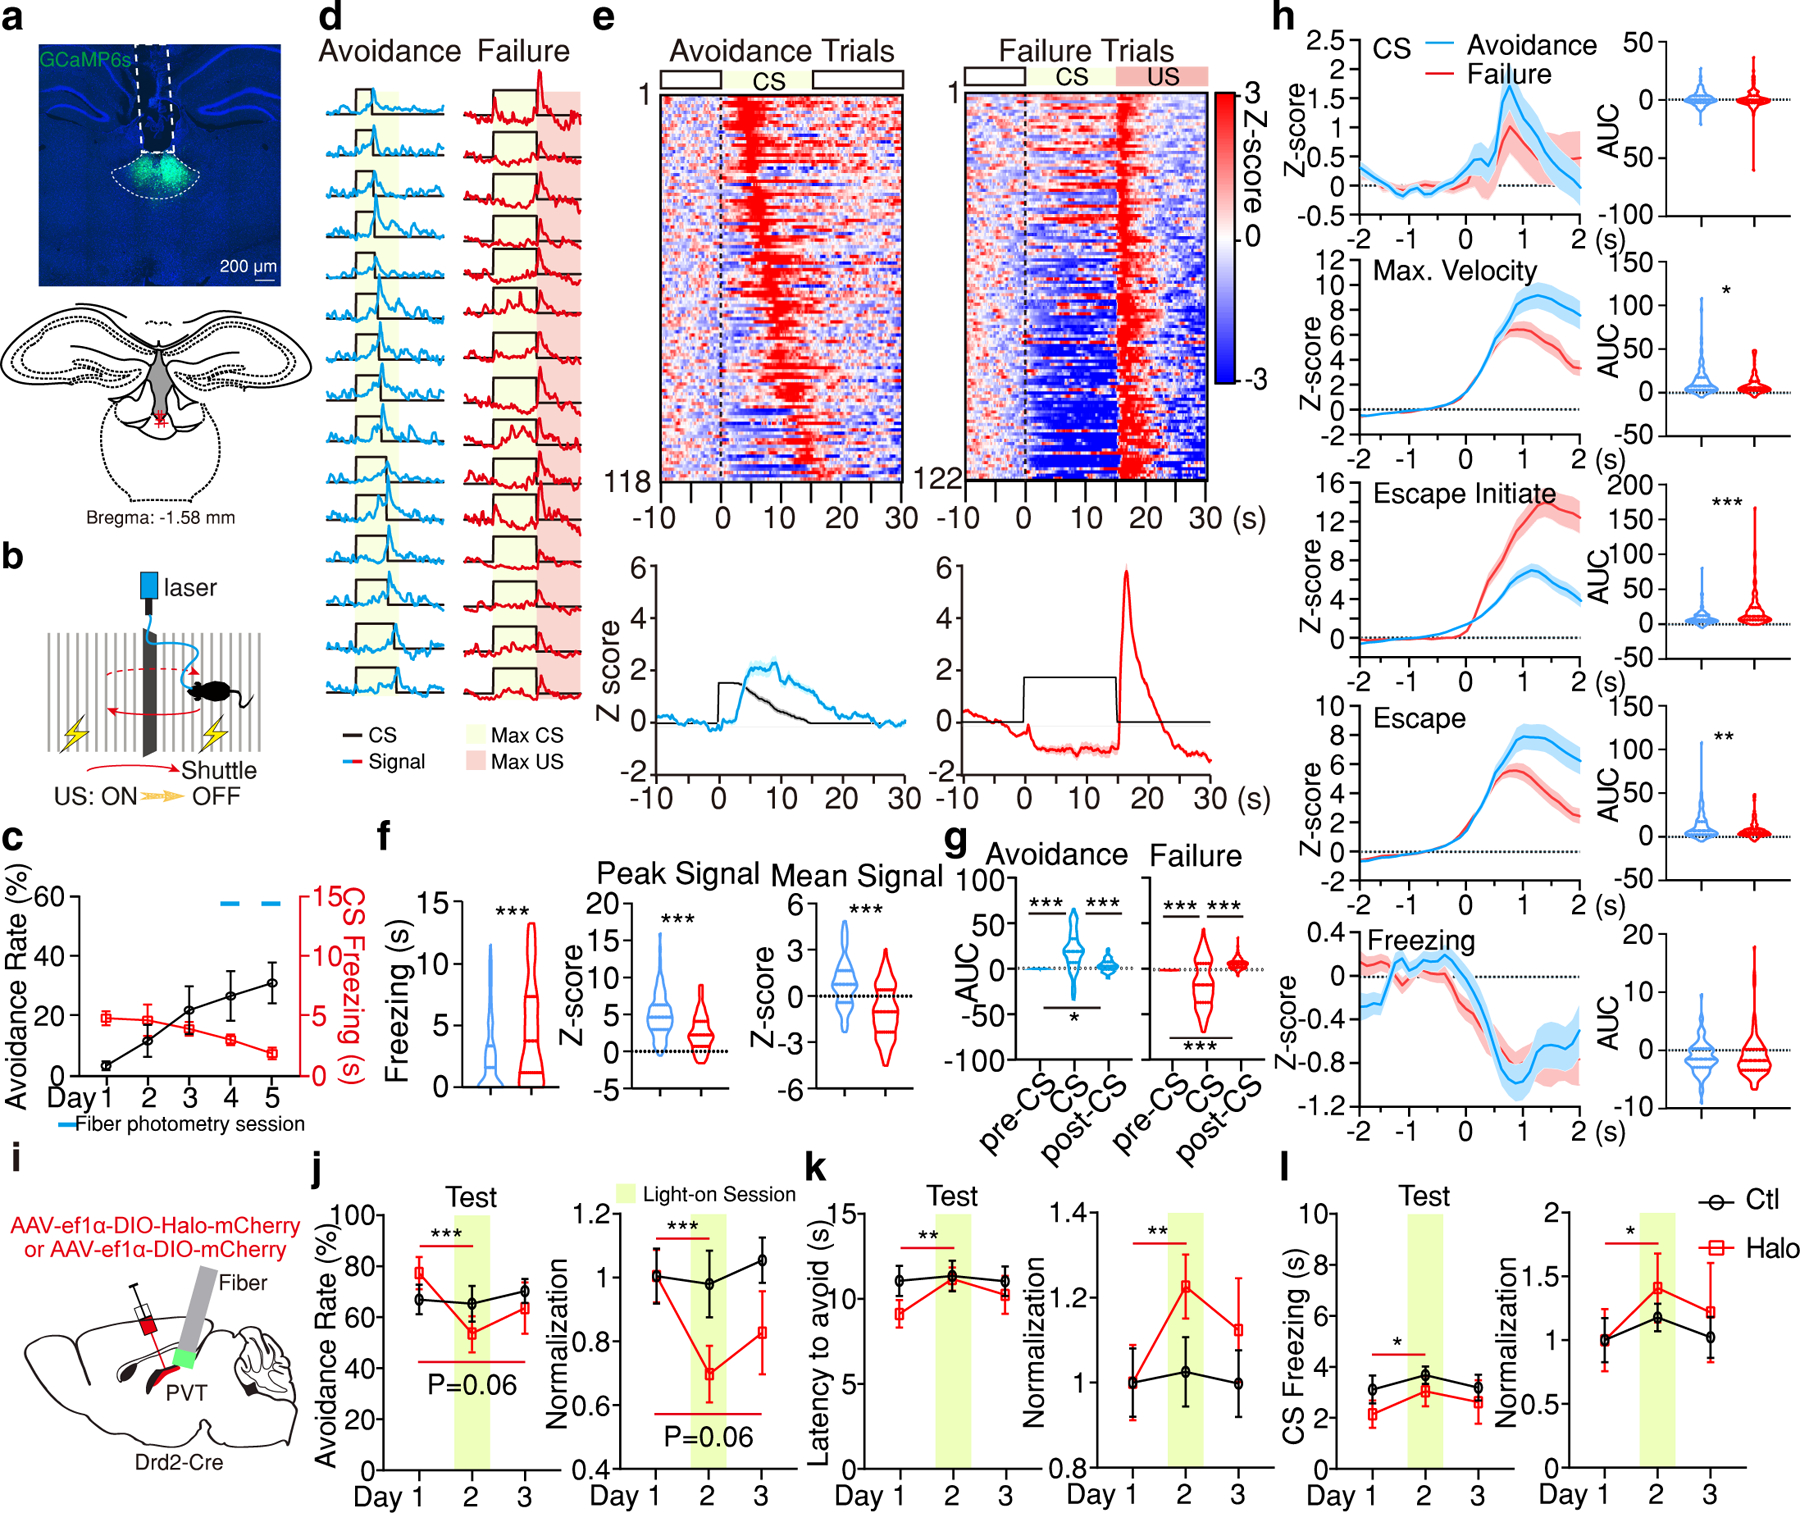
Figure 2. pPVTD2R neurons control active avoidance and are inhibited during freezing.

a, Representative image of GCaMP6s expression and fiber placements (n = 5 mice). b, Schematic of the 2AA task. c, Behavior performance during 2AA. d, Representative imaging traces for avoidance and failure trials. e, Top: Heatmaps of calcium responses. Bottom: Average calcium signal and CS (black line). f, Freezing, Peak, and Mean Signal during the CS for each trial type. Avoidance, n = 118 Trials; Failure, n = 122 Trials; two-tailed Student’s t-test. Freezing, ***P = 2.04E-06; Peak Signal, ***P = 1.19E-10; Mean Signal, ***P = 2.78E-15. g, Quantification of calcium signal for data in (e). AUC, One-way ANOVA followed by two-stage step-up procedure of Benjamini, Krieger and Yekutieli. Avoidance: n = 118 Trials; F(2, 351) = 75.89; group comparisons, pre-CS vs CS ***P < 0.001, pre-CS vs post-CS *P = 0.038, CS vs post-CS ***P < 0.001. Failure: n= 122 Trials; F(2, 363) = 66.54. ***P < 0.001. h, Left: Average responses for different events. Right: quantification of signal for each event on the left. AUC, two-tailed Student’s t-test. CS: Avoidance, n = 118 Events; Failure, n = 122 Events; P = 0.74. Max. Velocity: Avoidance, n = 117 Events; Failure, n = 122 Events; *P= 0.024. Escape initiate: Avoidance, n = 113 Events; Failure, n = 115 Events; ***P < 0.001. Escape: Avoidance, n = 118 Events; Failure, n = 122 Events; **P= 0.0064. Freezing: Avoidance, n = 92 Events; Failure, n = 157 Events; P = 0.98. i, Schematic for the silencing of pPVTD2R neurons. j-l, Avoidance rate (j), latency to avoid (k) and freezing during the CS (l). Behavior data normalized to Day 1 is included. Ctl, n = 8 mice; Halo, n= 9 mice, two-way ANOVA followed by two-stage linear step-up procedure of Benjamini, Krieger and Yekutieli. Avoidance Rate: F(2, 30) = 5.48; group comparisons, Halo, Day 1 vs Day 2 ***P < 0.001, Day 1 vs Day 3 P = 0.06. Latency to avoid: F(2, 30) = 2.48; group comparisons, Halo, Day 1 vs Day 2 **P = 0.0037. CS freezing: F(2, 30) = 0.19; group comparisons, Halo, Day 1 vs Day 2 *P = 0.04. All data in figure shown as mean ± s.e.m.
