
Figure 7. Optogenetic inhibition pPVTD2R–CeA axon terminals increases active avoidance and reduces freezing.
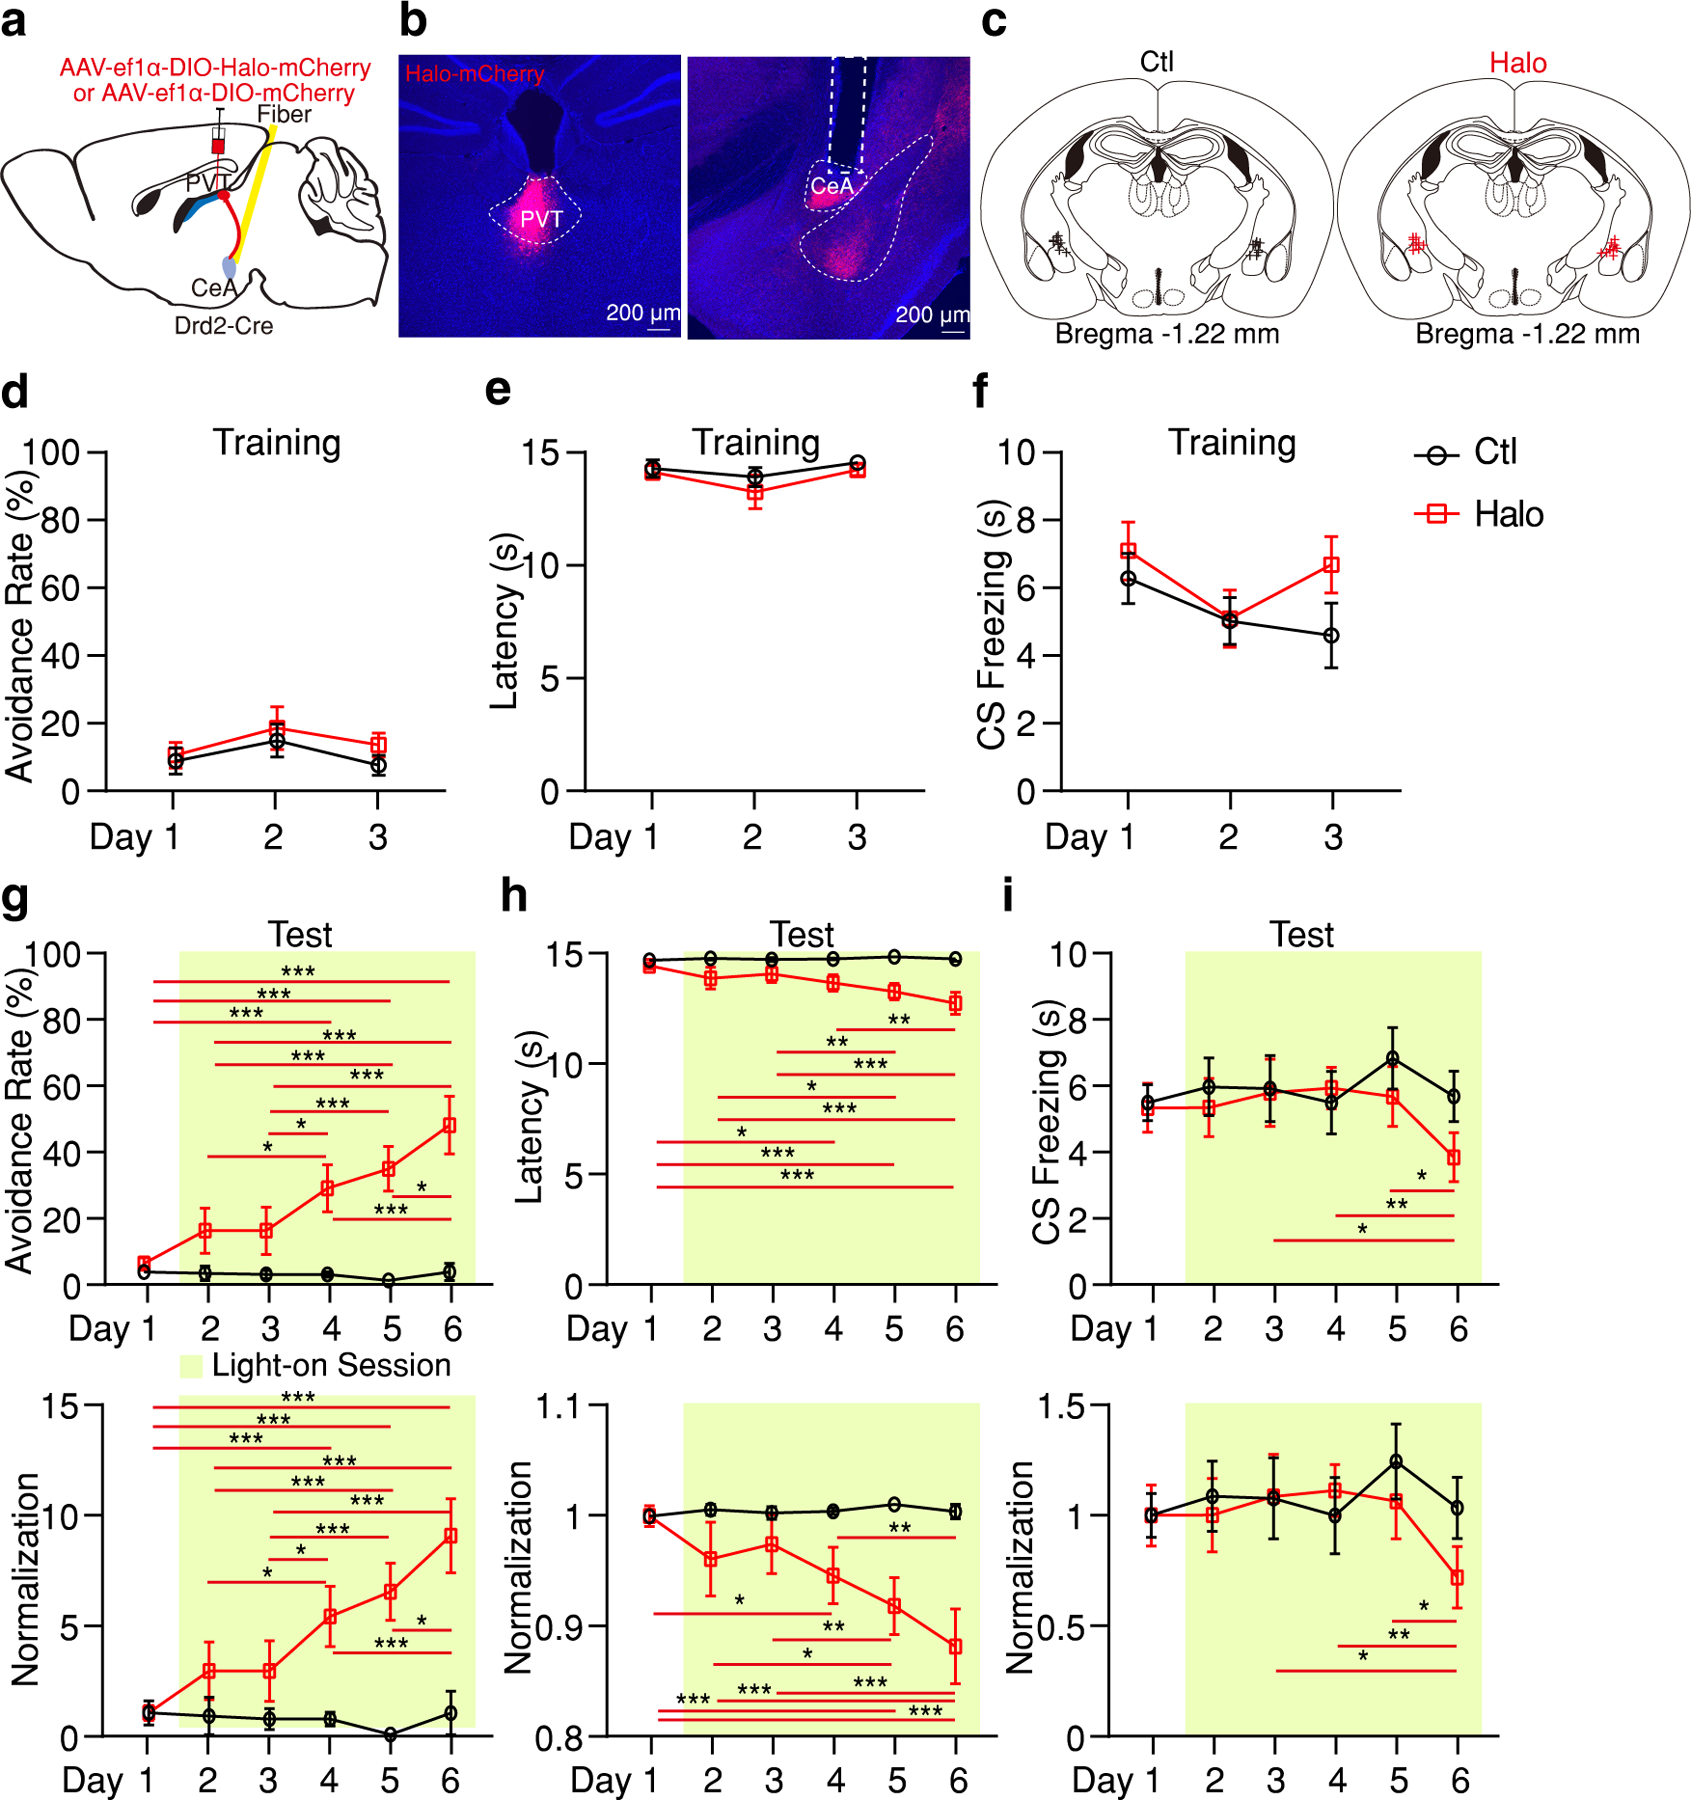
a, Schematic of the viral vector strategy and optical fiber placement used for optogenetic silencing of pPVTD2R–CeA axon terminals. b, Representative images from a mouse expressing Halo-mCherry in pPVTD2R neurons and implanted with optical fibers in the CeA. c, Fiber placements (n = 9 mice per group). d-f, Avoidance rate (d), latency to avoid (e) and freezing time during the CS (f) across all training days in both Ctl and Halo groups. g-i, Top: Avoidance rate (g), latency to avoid (h) and freezing time during the CS (i) during optogenetic inhibition of pPVTD2R–CeA axon terminals. Bottom: Normalization to Day 1 for each group. Two-way ANOVA followed by two-stage linear step-up procedure of Benjamini, Krieger and Yekutieli. Avoidance rate: F(5, 80) = 9.05; group comparisons, Halo, Day 1 vs Day 4 ***P < 0.001, Day 1 vs Day 5 ***P < 0.001, Day 1 vs Day 6 ***P < 0.001, Day 2 vs Day 4 *P = 0.015, Day 2 vs Day 5 ***P < 0.001, Day 2 vs Day 6 ***P < 0.001, Day 3 vs Day 4 *P = 0.015, Day 3 vs Day 5 ***P = 0.0005, Day 3 vs Day 6 ***P < 0.001, Day 4 vs Day 6 ***P < 0.001, Day 5 vs Day 6 *P = 0.012. Latency to avoid: F(5, 80) = 4.52; group comparison, Halo, Day 1 vs Day 4 *P = 0.011, Day 1 vs Day 5 ***P < 0.001, Day 1 vs Day 6 ***P < 0.001, Day 2 vs Day 5 *P = 0.043, Day 2 vs Day 6 ***P = 0.0003, Day 3 vs Day 5 **P = 0.0085, Day 3 vs Day 6 ***P < 0.001, Day 4 vs Day 6 **P = 0.0027. CS freezing: F(5, 80) = 1.17; group comparisons, Halo, Day 3 vs Day 6 *P = 0.012, Day 4 vs Day 6 **P = 0.007, Day 5 vs Day 6 *P = 0.018. All data in figure shown as mean ± s.e.m.